Analysis of Emotet/Trickbot (Part-2)
Part two of the analysis of Emotet
Emotet - A Deeper Dive (Part - 2)
Introduction
I know its been a while, but I finally restored an existing snaphshot of VM and the random shutdown problem has reduced (yay! 🎊). I kinda left the last post in a hurry, it was super late and I was feeling very sleepy. I am gonna start this blog off from exactly where I left it, i.e, phase-3.
This phase was super interesting and I got to learn a lot about WOW64, several anti-analysis and anti-sandbox techniques.
Again this explanation might be a bit messy and long but I have made sure to explain everything(or atleast the majority) in a simple manner to avoid confusion.
Disclaimer/Warning
I am not an expert in malware analysis nor am I a malware developer, please take my word with a grain of salt and do your own research before doing anything.
I take no responsibility or accountability for infection of malicious software, programs, or files onto any computer or workstation. These projects are for educational purposes only. I do not condone the development, use, or spreading of programs to intentionally harm assets, networks, or individuals.
I do not own the malware/program nor am I claiming to be the author of the program all rights and ownership go to the person/team who designed it.
Phase-3
If you can recall, we found 2 PE files inside the esi function structure, both were copied to a memory location and given different permissions. The control was then transferred to the first PE file’s .text section (presumeably).
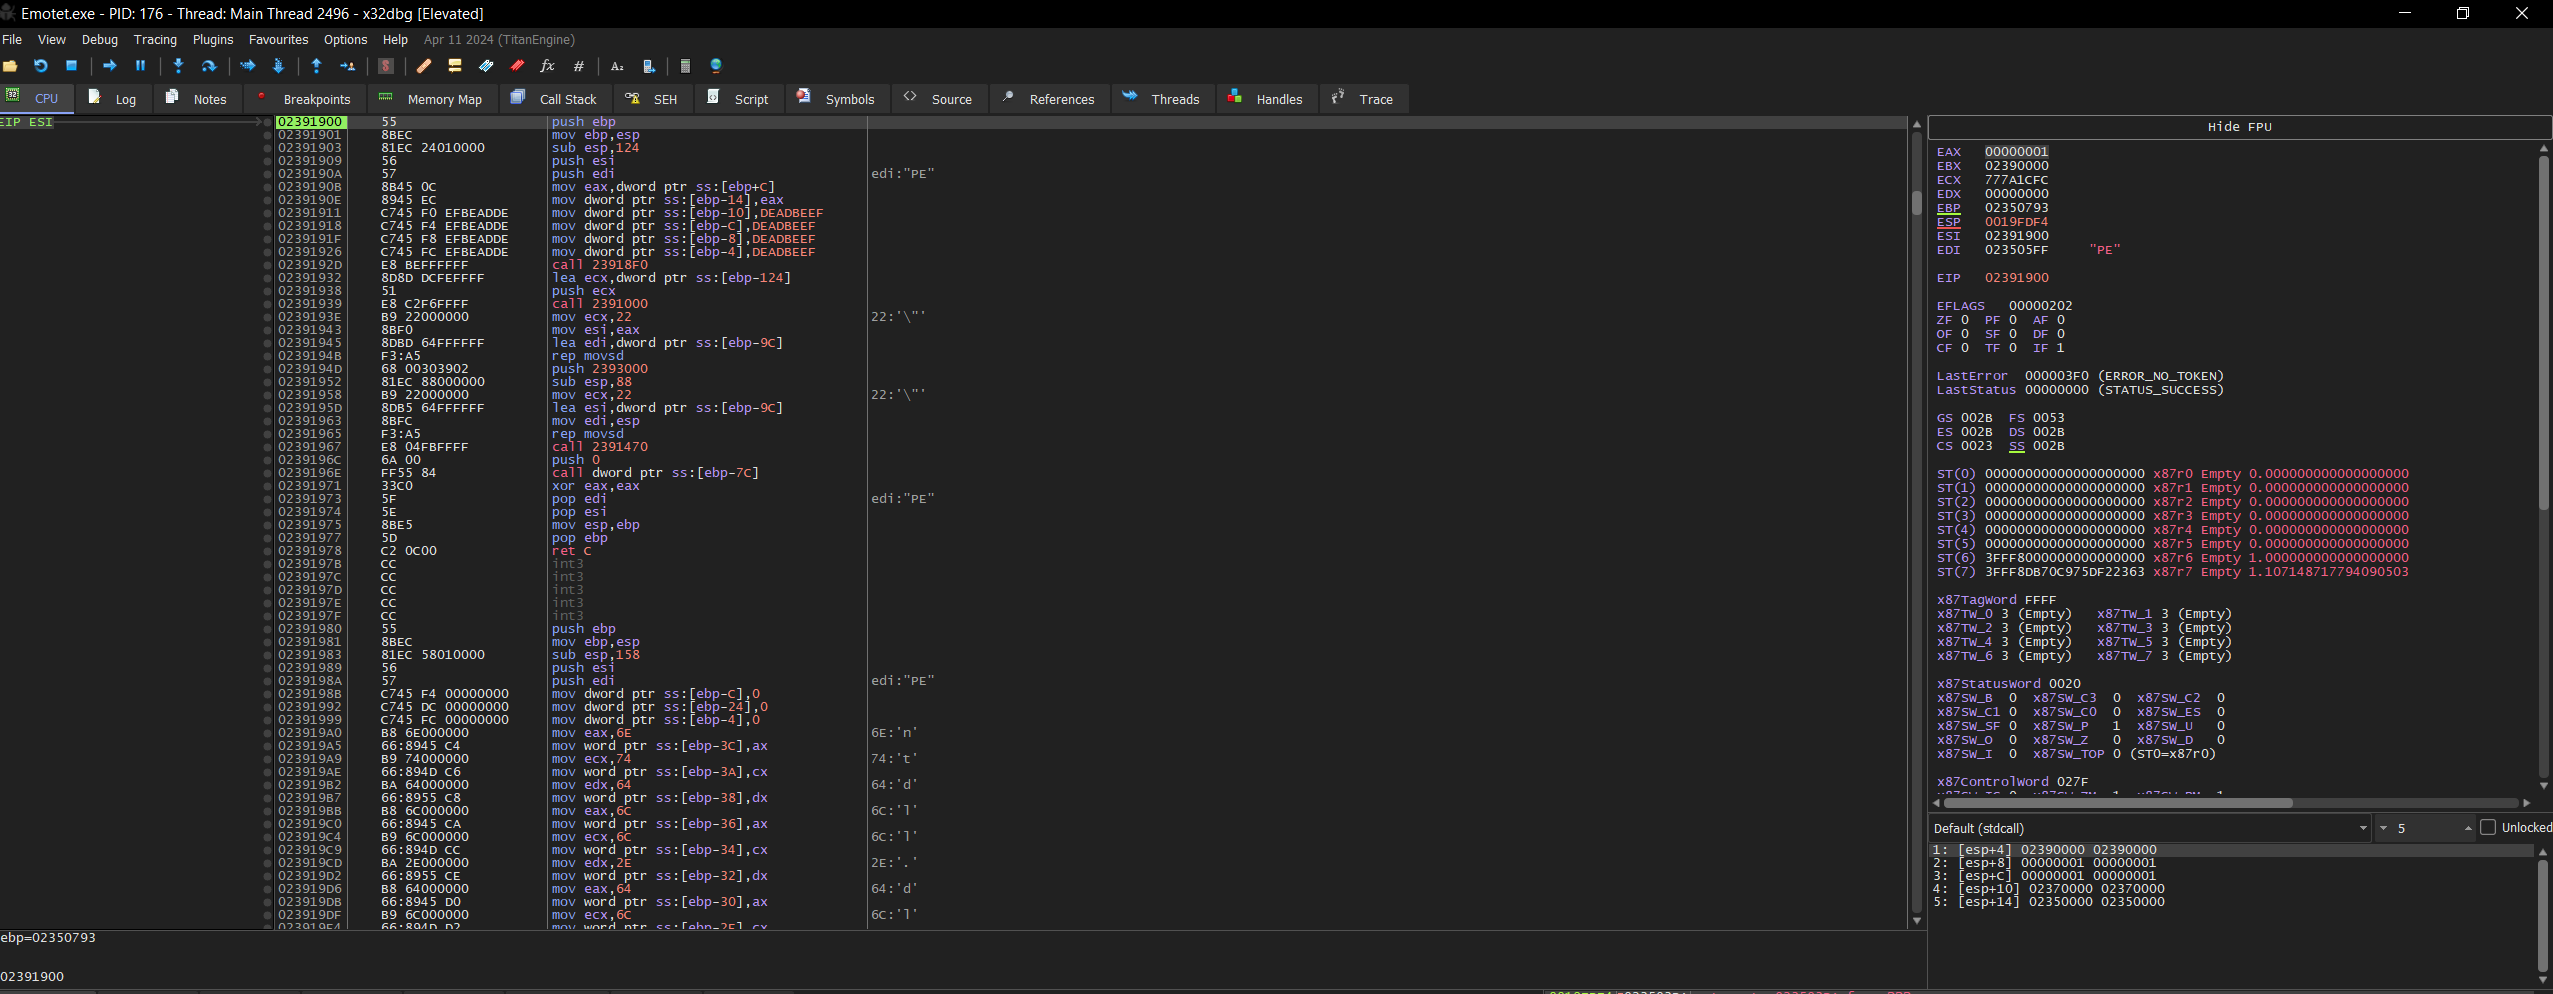
First, the function loads some useless bytes inside the stack (0xDEADBEEF) and then we move into a sub routine to retrive some 30-or-so functions.
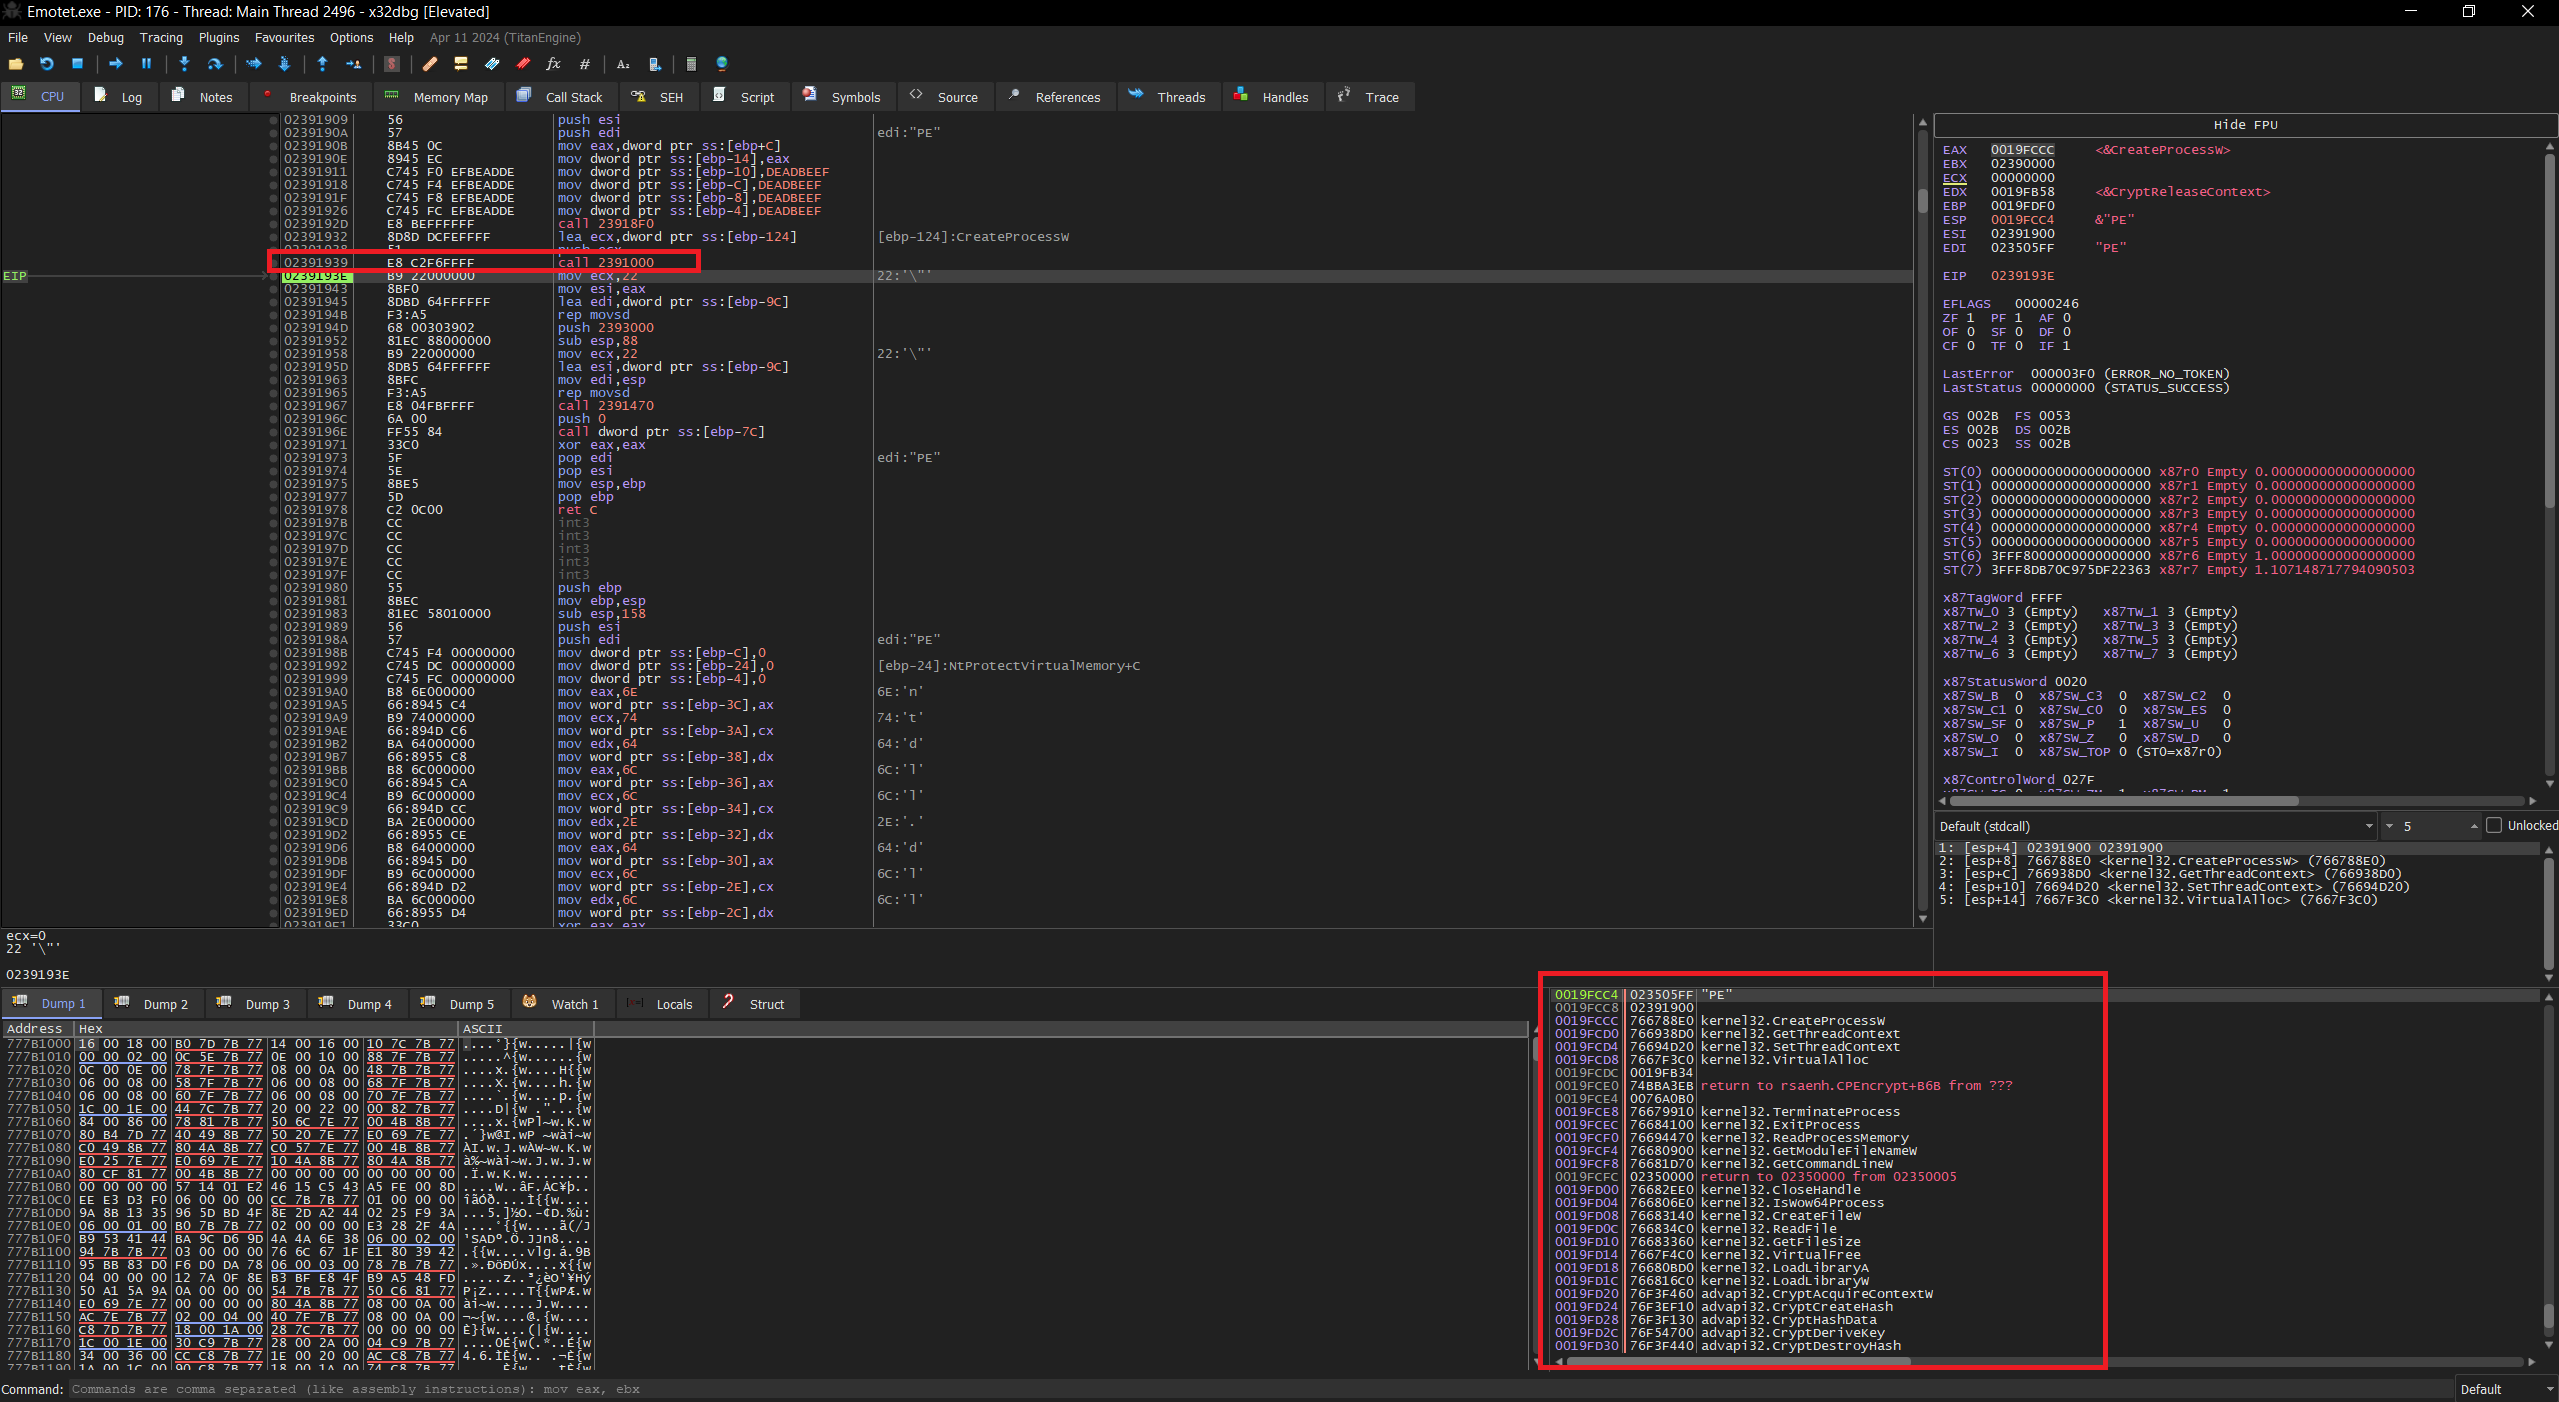
- As we can see in the image below, the 0x2391000 subroutine imports several windows api that are used by the function below (0x2391470).
Now we can get into the function that consumed a solid three days of my life to understand, 0x2391470.
The function first creates a process with the same name as itself.
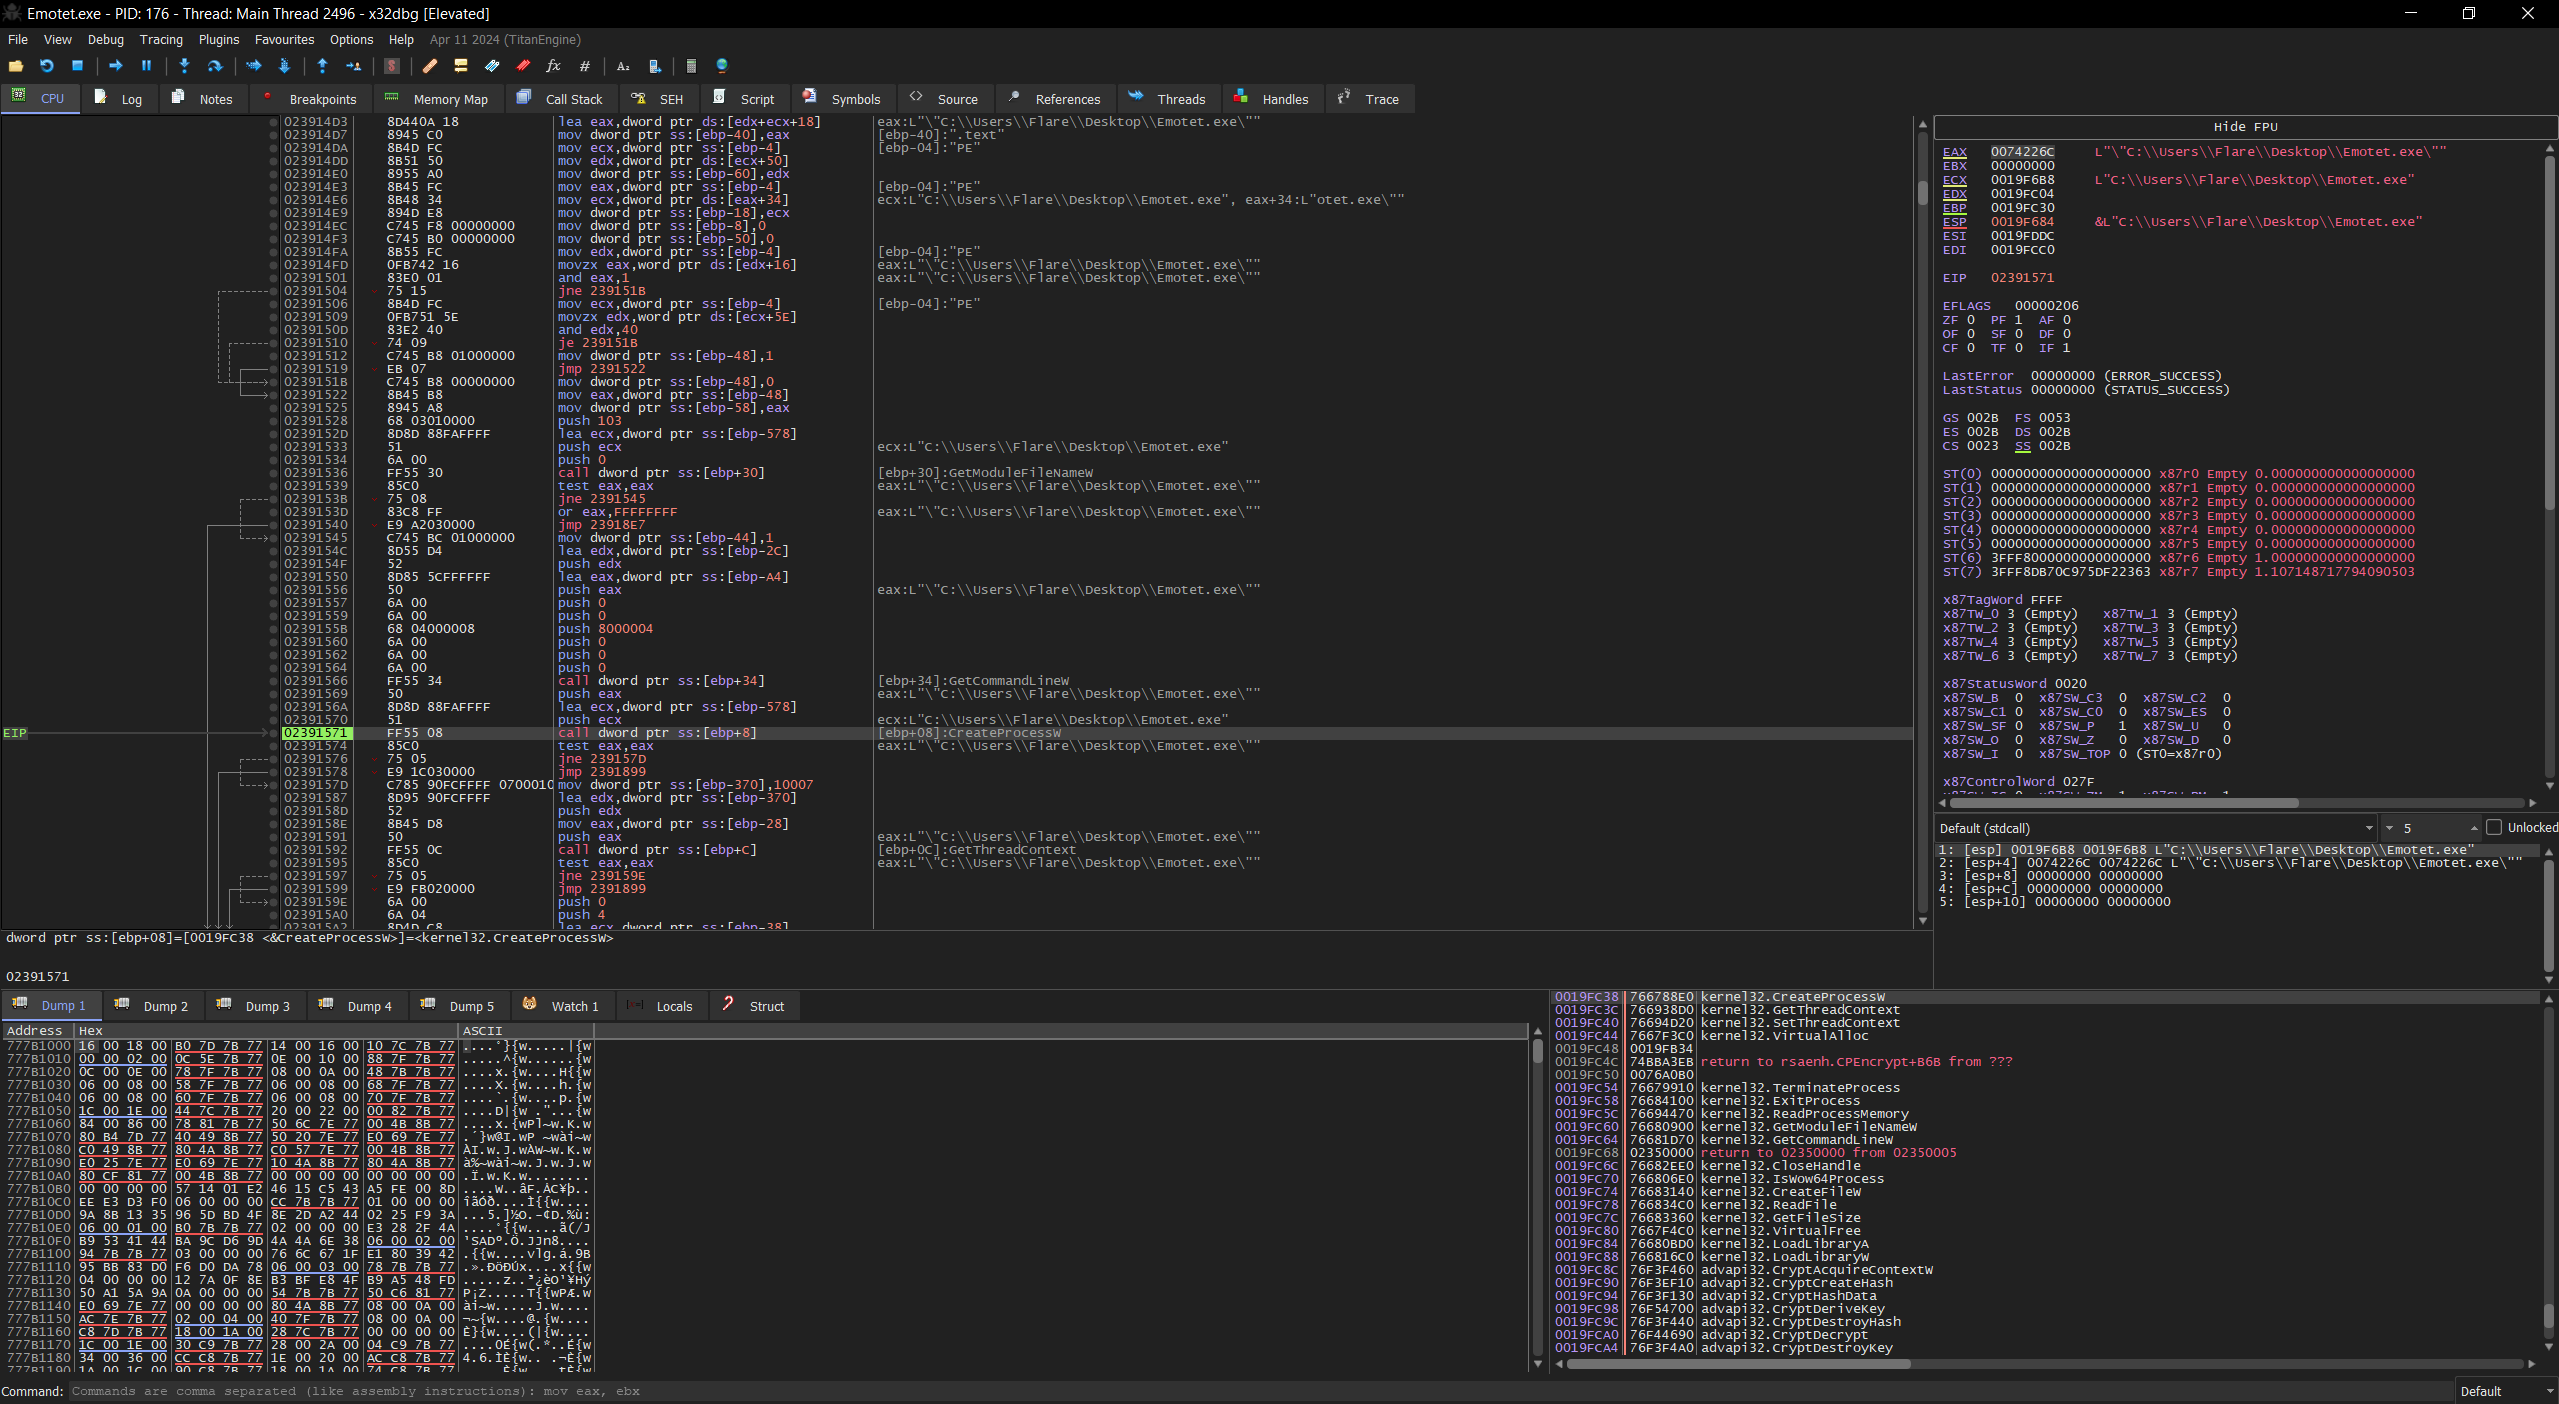
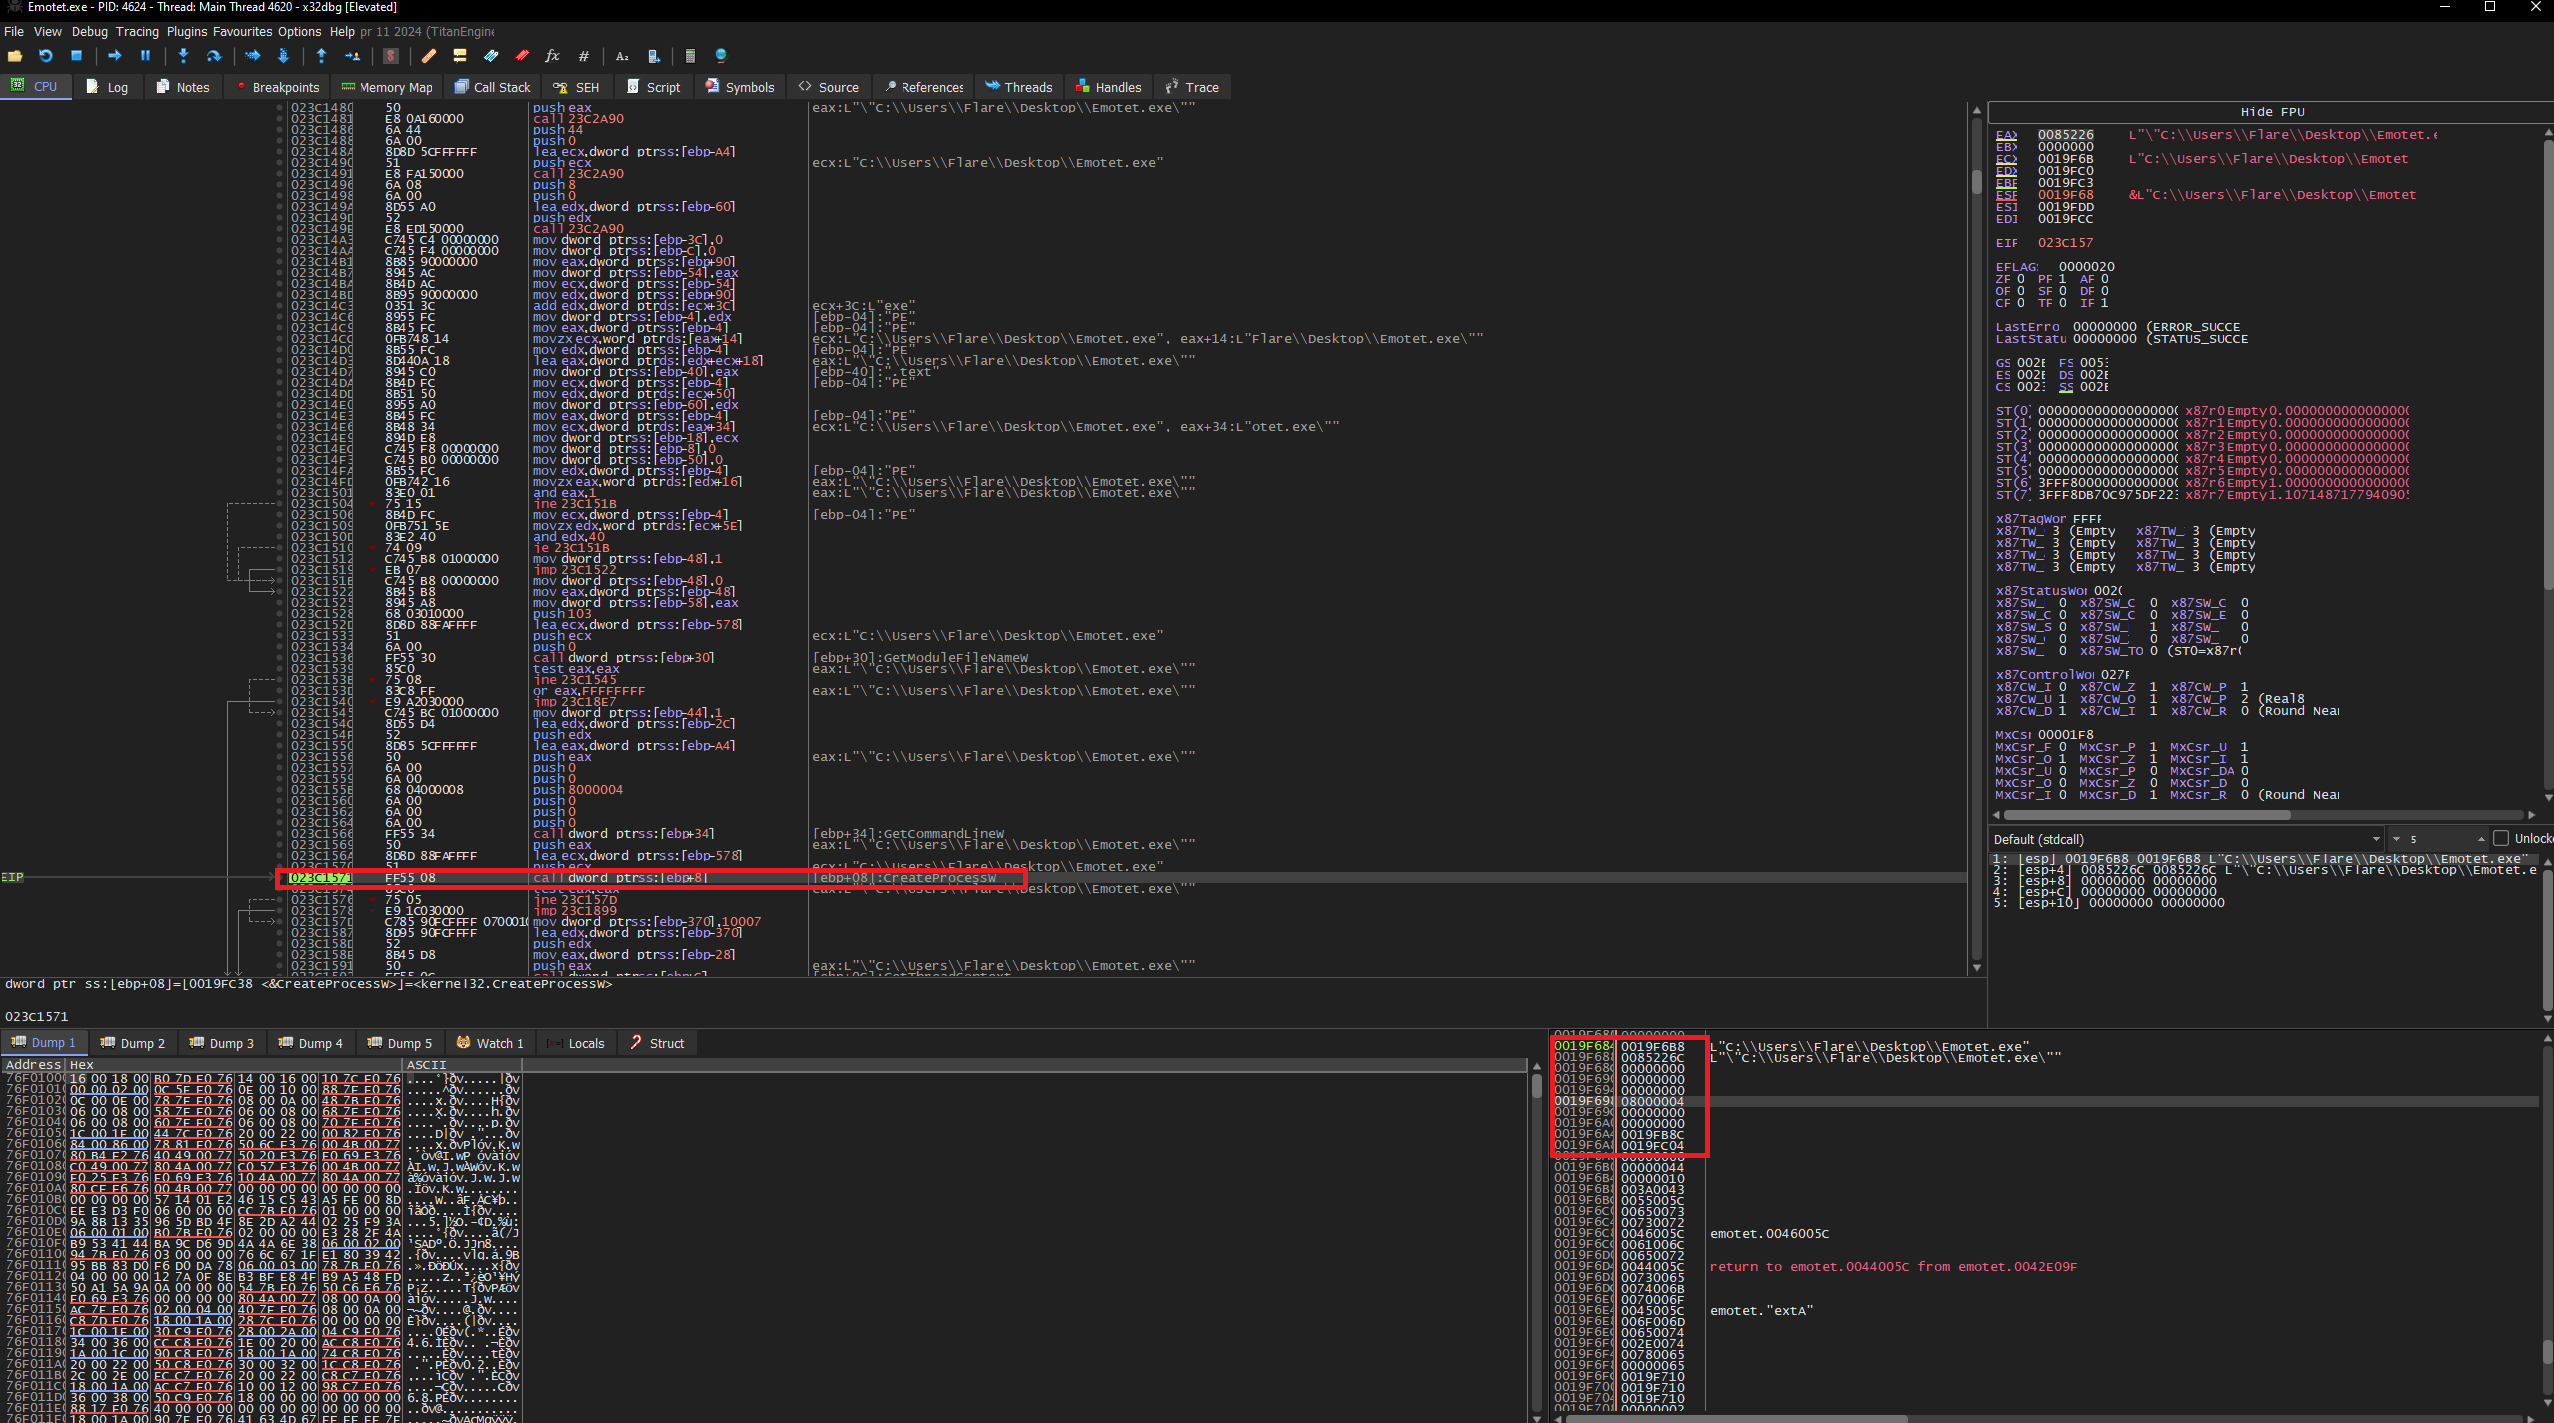
A important information to note here is the creation flag that was set for this process 0x80000004, this means the child process will spawn as a suspended process and no window will be launched for this process.
The function prototype is as follows,
1
2
3
4
5
6
7
8
9
10
11
12
13
BOOL CreateProcessW(
  [in, optional]      LPCWSTR               lpApplicationName,
  [in, out, optional] LPWSTR                lpCommandLine,
  [in, optional]      LPSECURITY_ATTRIBUTES lpProcessAttributes,
  [in, optional]      LPSECURITY_ATTRIBUTES lpThreadAttributes,
  [in]                BOOL                  bInheritHandles,
  [in]                DWORD                 dwCreationFlags,
  [in, optional]      LPVOID                lpEnvironment,
  [in, optional]      LPCWSTR               lpCurrentDirectory,
  [in]                LPSTARTUPINFOW        lpStartupInfo,
  [out]               LPPROCESS_INFORMATION lpProcessInformation
);
- The 6th parameter is the creation flag.
Note : I had to restart my VM agian >:( So the addresses are not the same, sorry! but the functions should always have the same offset. Basically, the functions should be something like 0x???1470 or 0x???1000 everytime. The last 4 bytes remain the same as they are the offset from the allocated memory.
- If we open up procexp we can see this new process being spawned as a suspended child process under our current process.
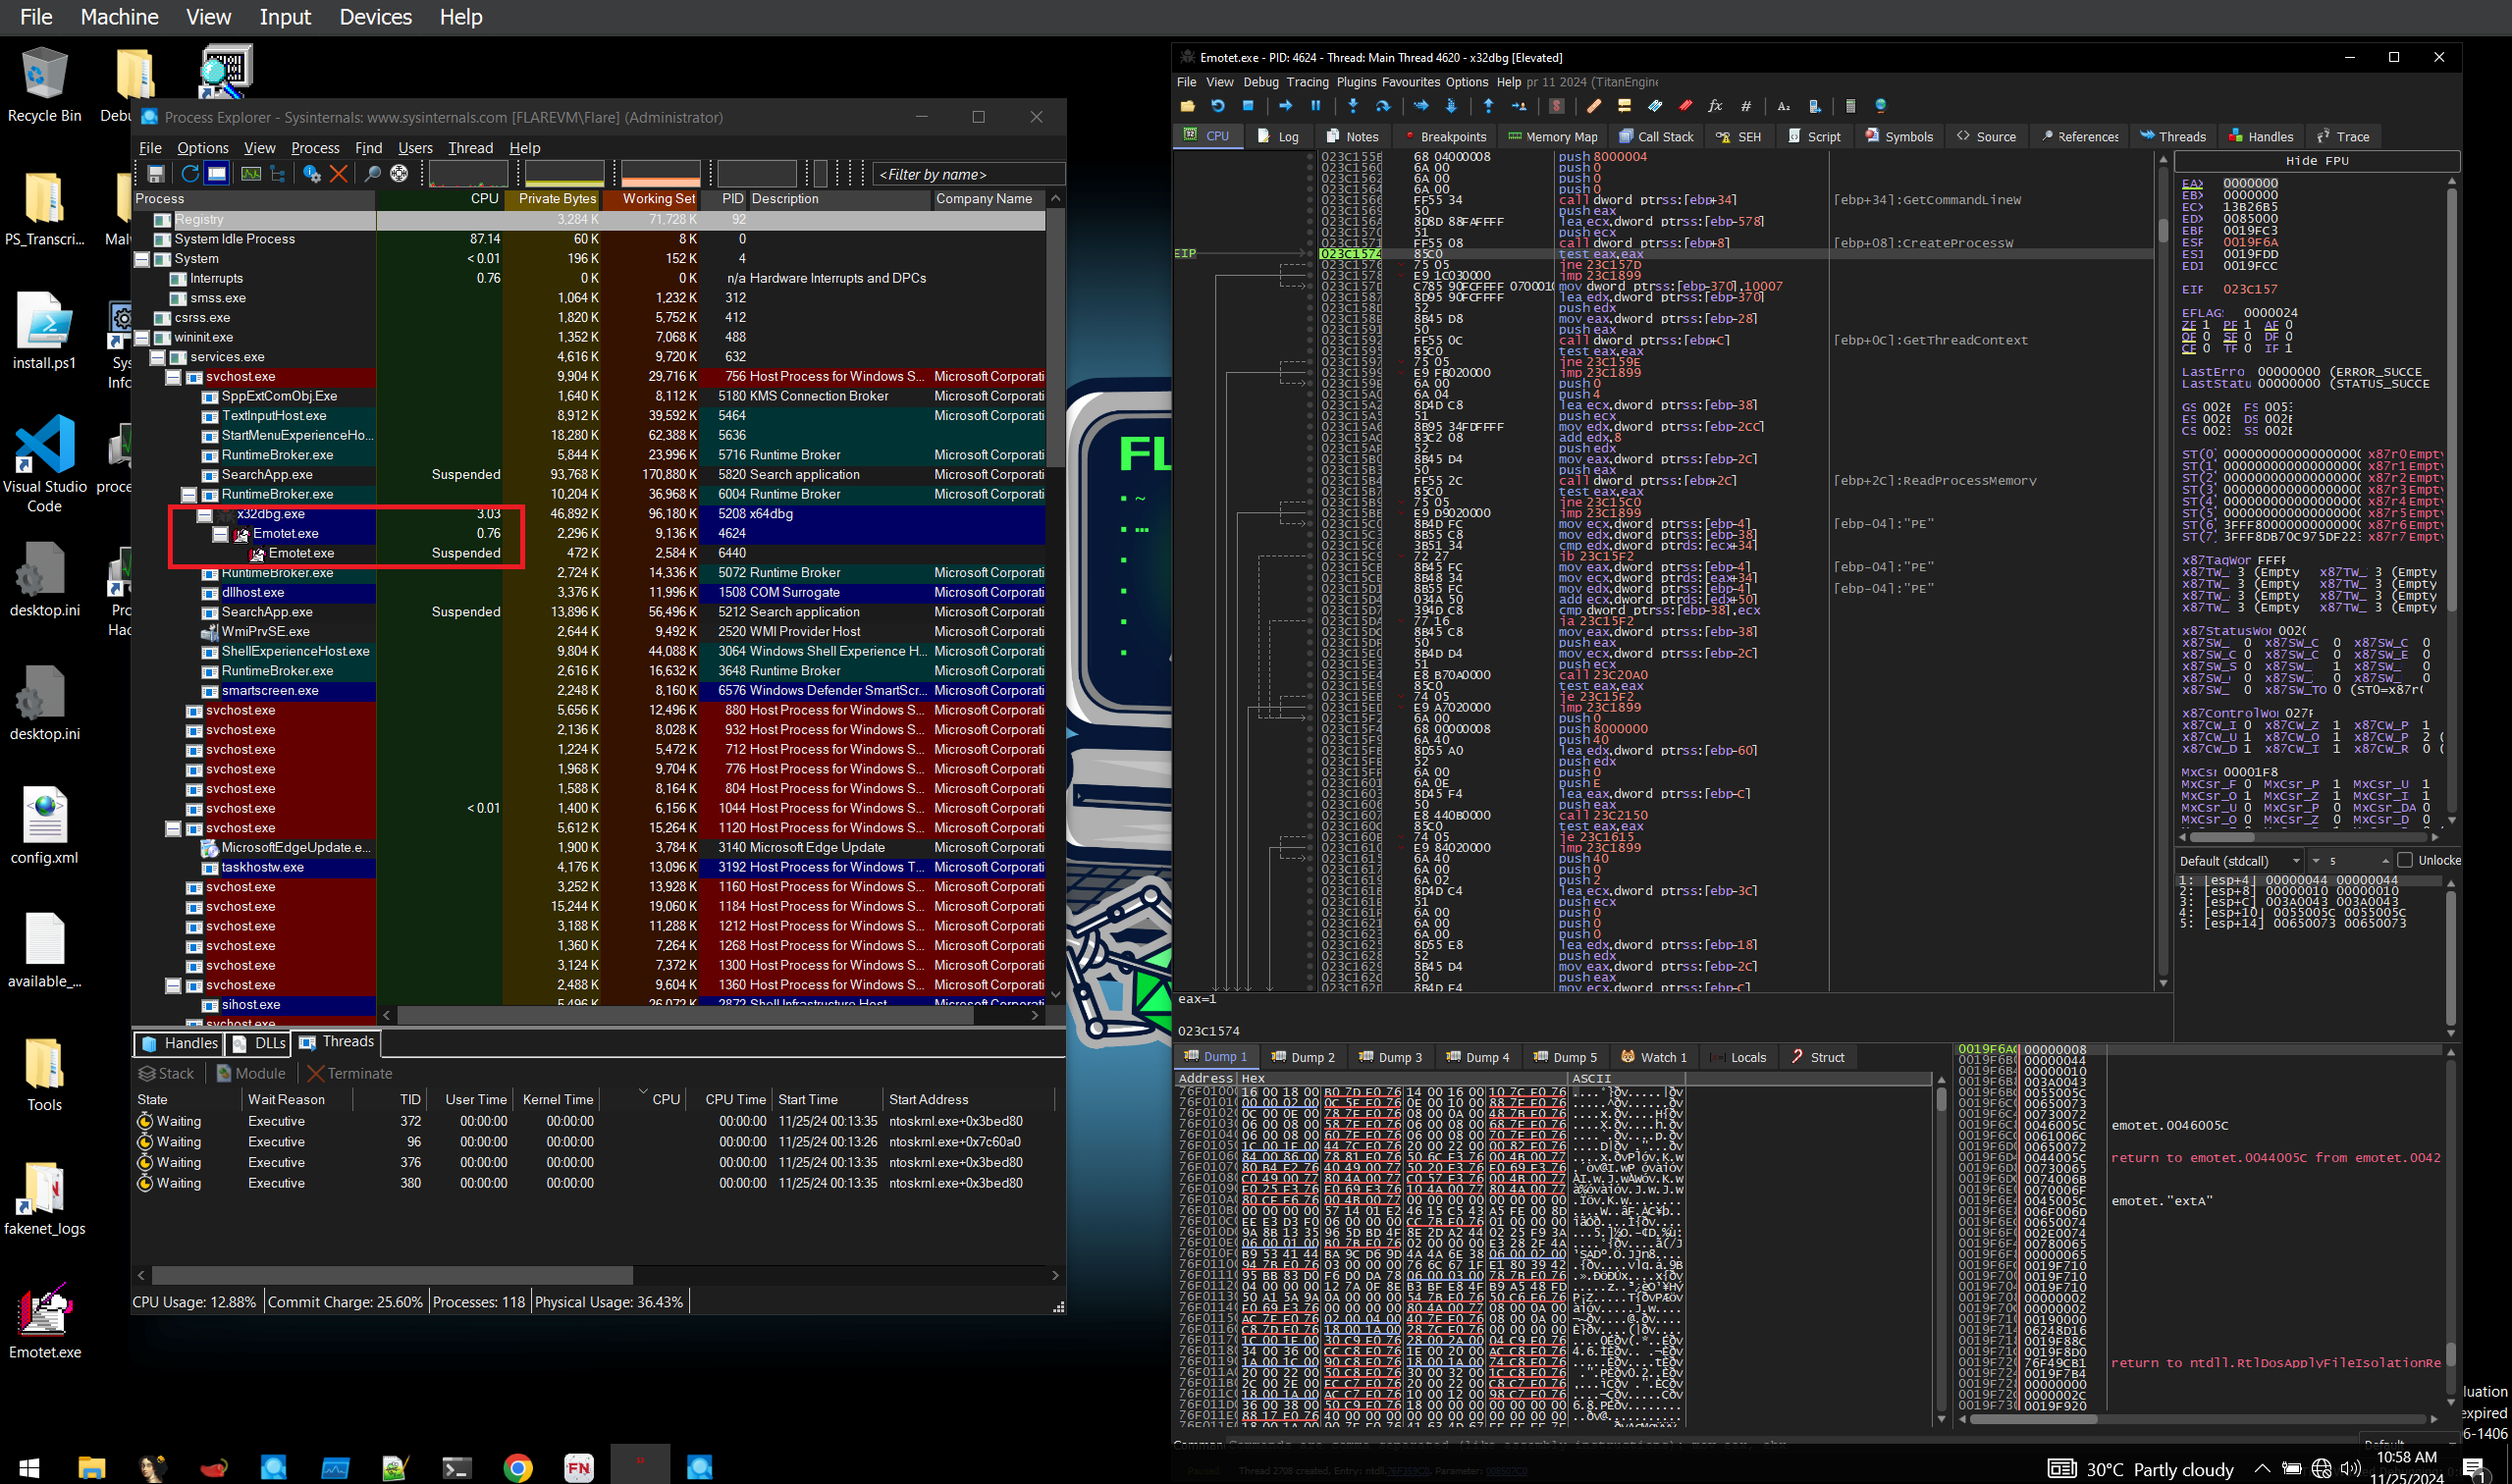
Before we continue, I must explain what this program is attempting to do.
I know its a bit premature to predict what this program is attmpting to do, but knowing what to look for is a lot more efficient that stepping through a bunch of assembly instruction.
From what I can understand this program is attempting to do a process hollowing, this is a common technique employed by various malware to run arbritary code through another process.
Tangent-1 Process Hollowing 💀
Basically, Process hollowing is a technique used by attackers where the parent process creates a new process in a suspended state, typically a legitimate executable. The original process then ‘hollows out’ the memory of this target process, replacing its original executable code with malicious code. The entry point of the process is updated to point to the malicious code, and the process is resumed, effectively running the attacker’s code under the guise of a legitimate process.
Here the process does not hollow out any other process(which is a pretty common tactic), rather, it creates a suspended duplicate process and then hollows it out(presumeably)
The process is done as follows,
1
2
3
4
5
6
7
8
9
10
11
1.(Create a Process) -> using CreateProcessW()
|
|___2.(Get the current thread context) -> using GetThreadContext()
    |
    |____3.('Hollow out' the process) -> using UnmapViewOfSection()
        |
        |_____4.(Copy the malicious executable code into this hollowed out process ) -> using WriteProcessMemory()
            |
            |______5.(Change the CONTEXT structure to set starting point) -> using SetThreadContext()
                |
                |_______ 6.(Resume the new process from its suspended state) -> using ResumeThread()
The Thread conext is basically a structure defined by windows, which stores a bunch of registers and reserved fields for a process. So, GetThreadContext, retrives a snapshot of the registers and other stuff of the target process and SetThreadContext changes these registers.
With a basic understanding of how process hollowing works, we can streamline the analysis by focusing on specific breakpoints rather than stepping through the executable instruction by instruction. This allows us to pinpoint the moment the new executable is injected and executed within the hollowed process.
By the time we reach the final stages of the hollowing process (typically after copying the malicious executable into the target process), the program prepares to change the entry point to the new code and resumes execution. This is often done using functions like SetThreadContext() to set the new instruction pointer or ResumeThread() to start execution.
At this stage, any obfuscation or encryption applied to the malicious executable is likely undone, as the code must be in a runnable state for execution.
To extract the de-obfuscated executable, we can set a breakpoint on ResumeThread() or SetThreadContext(). When these functions are called, we can dump the process’s memory to obtain the fully reconstructed executable.
A great resource that explains process hollowing - here
With that this tangent is over.
Phase-3 (Cont…)
With that overview of process hollowing technique we can set a break point at the 4th, 5th or the 6th step to dump the memory and obtain the malicous PE.
This process creates a duplicate process and gets the thread context of the created executable, so we can make a relatively educated guess that this program uses the process hollowing technique.
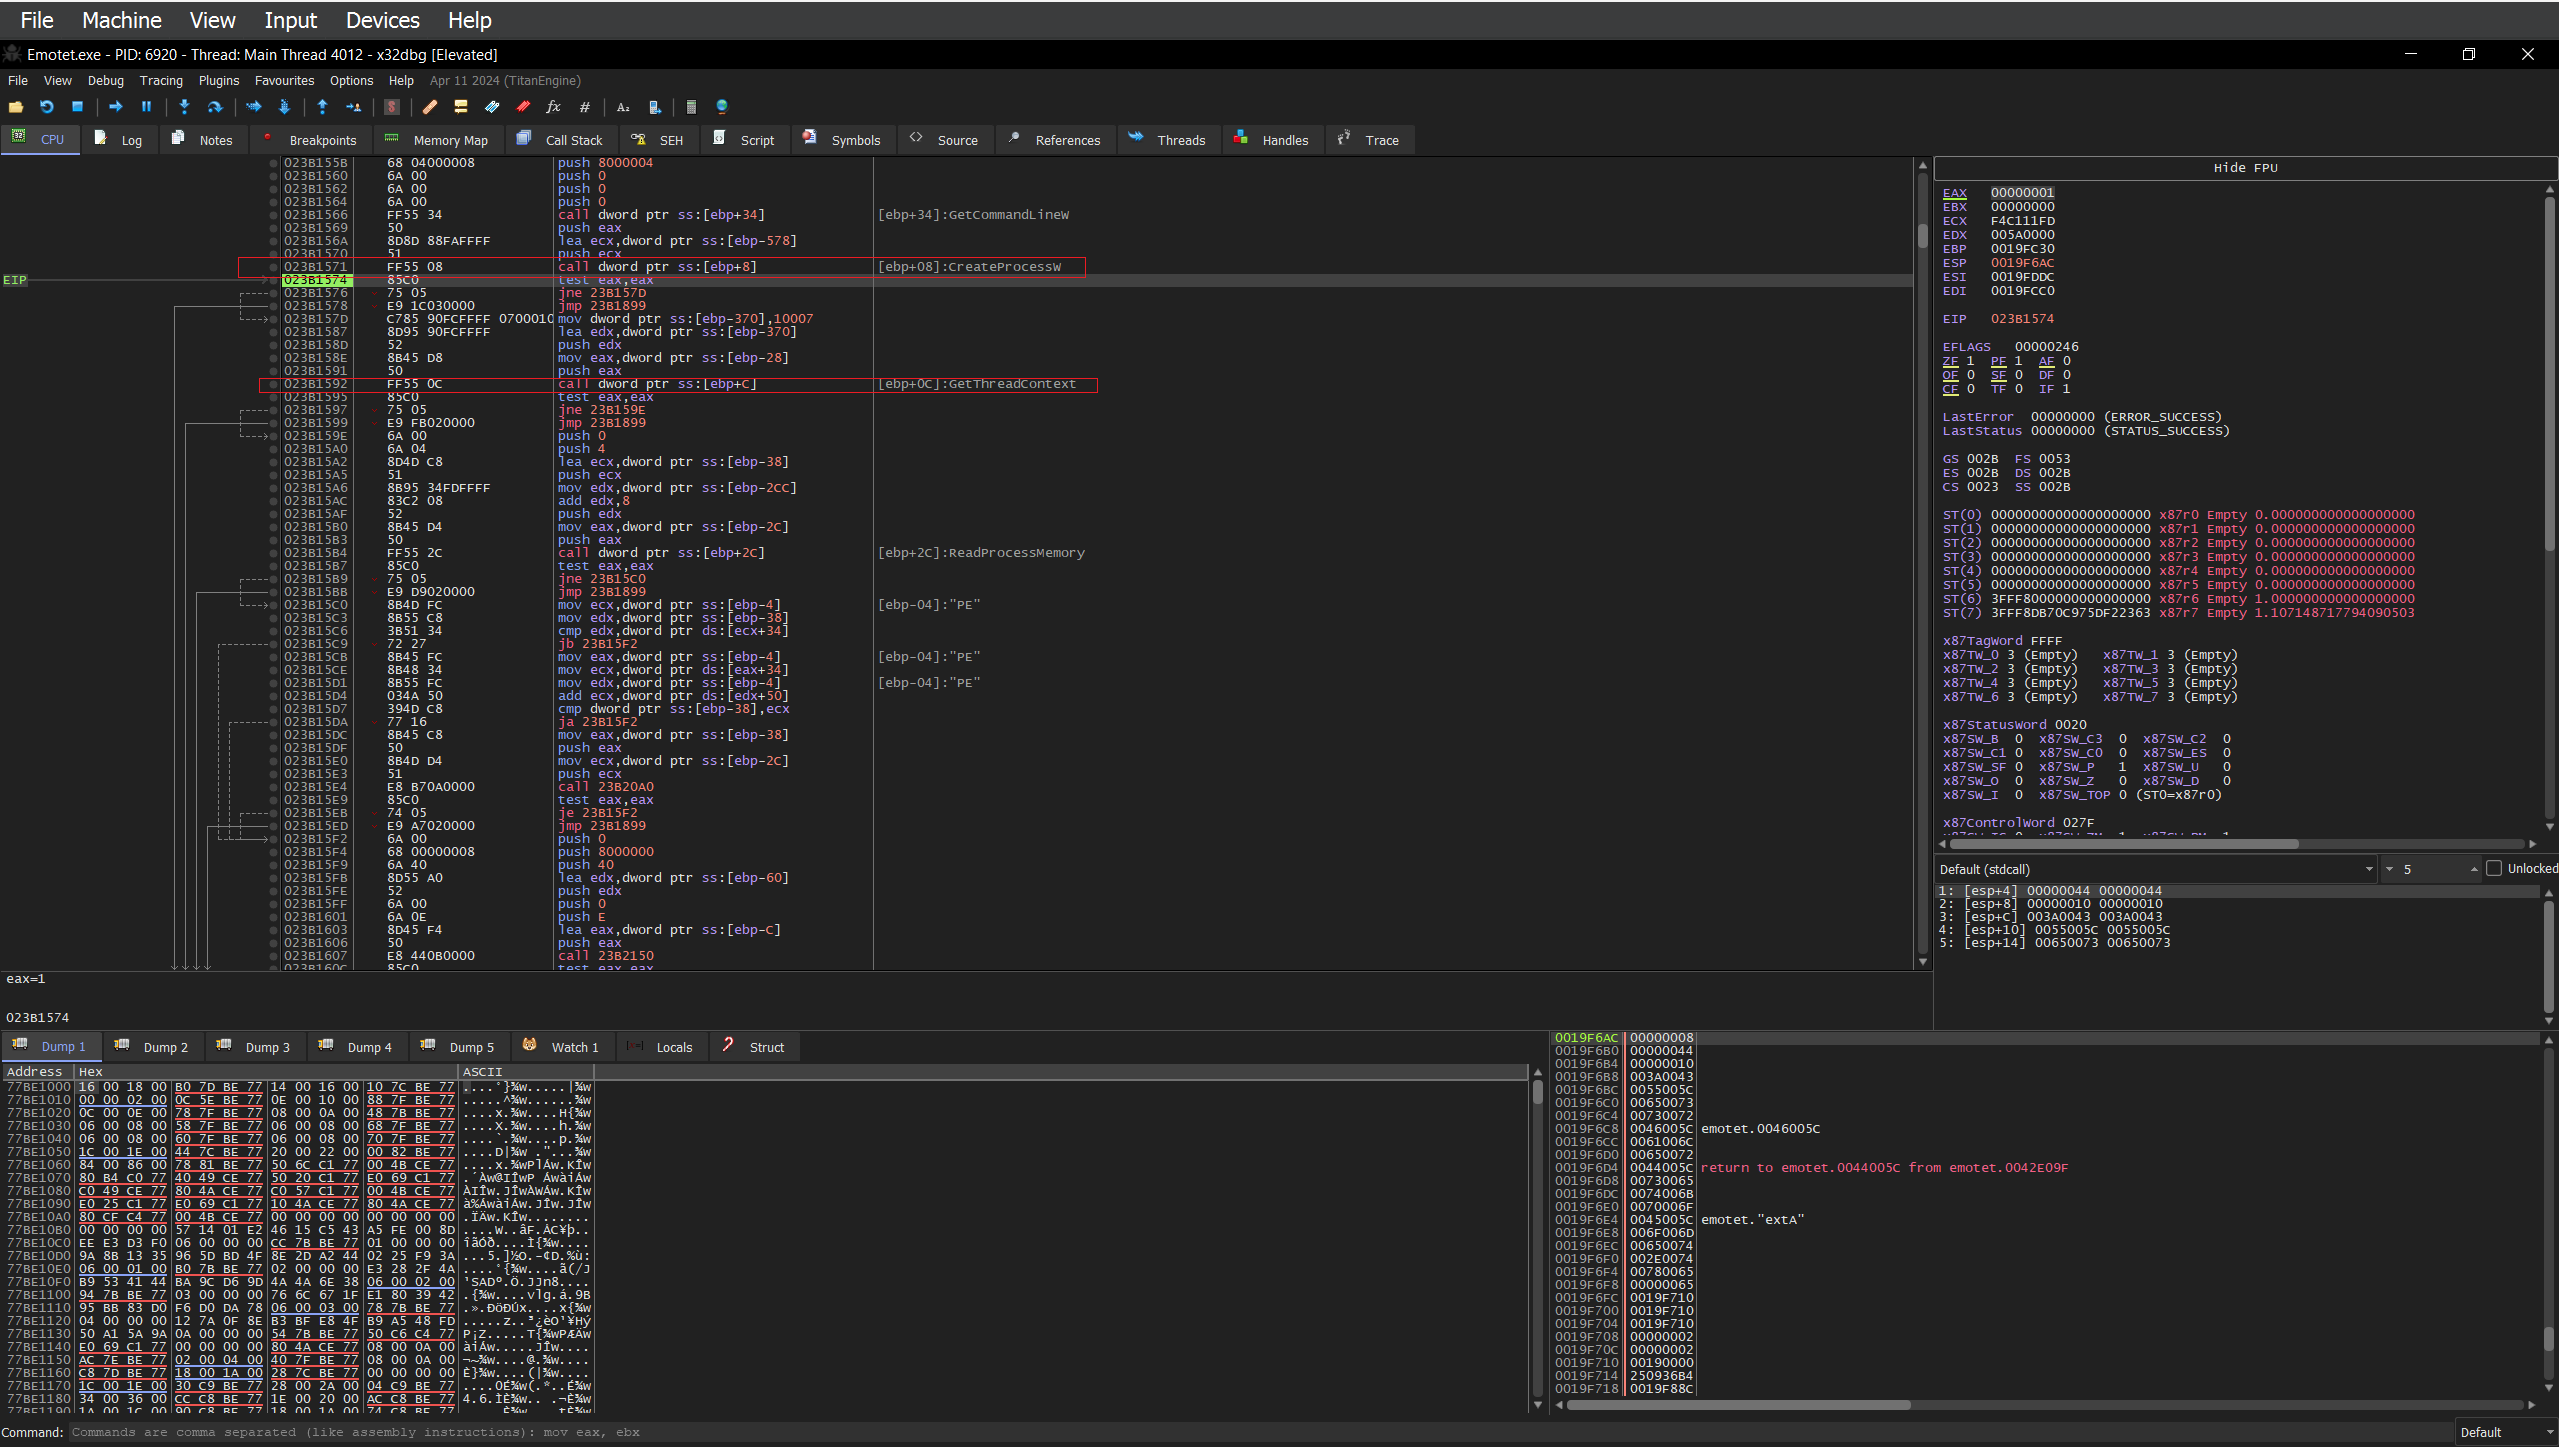
Now we can set a breakpoint to WriteProcessMemory() or ResumeThread() to stop the program and dump the new PE.
Unfortunately, the program does not stop the execution at the set breakpoint, even if we set the breakpoint to the kernel level call function, I couldn’t get the process to stop from resuming.
The process must be resumed using some method, but no function calls to ResumeThread were made. how is this possible?
To pinpoint exactly were the function resumed the target process I opened up procexp and stepped over each function calls to pinpoint exactly which function resumed the process.
And this was the function which resumed the child process 0x23B1FD0 ( or 0x???1FD0 )
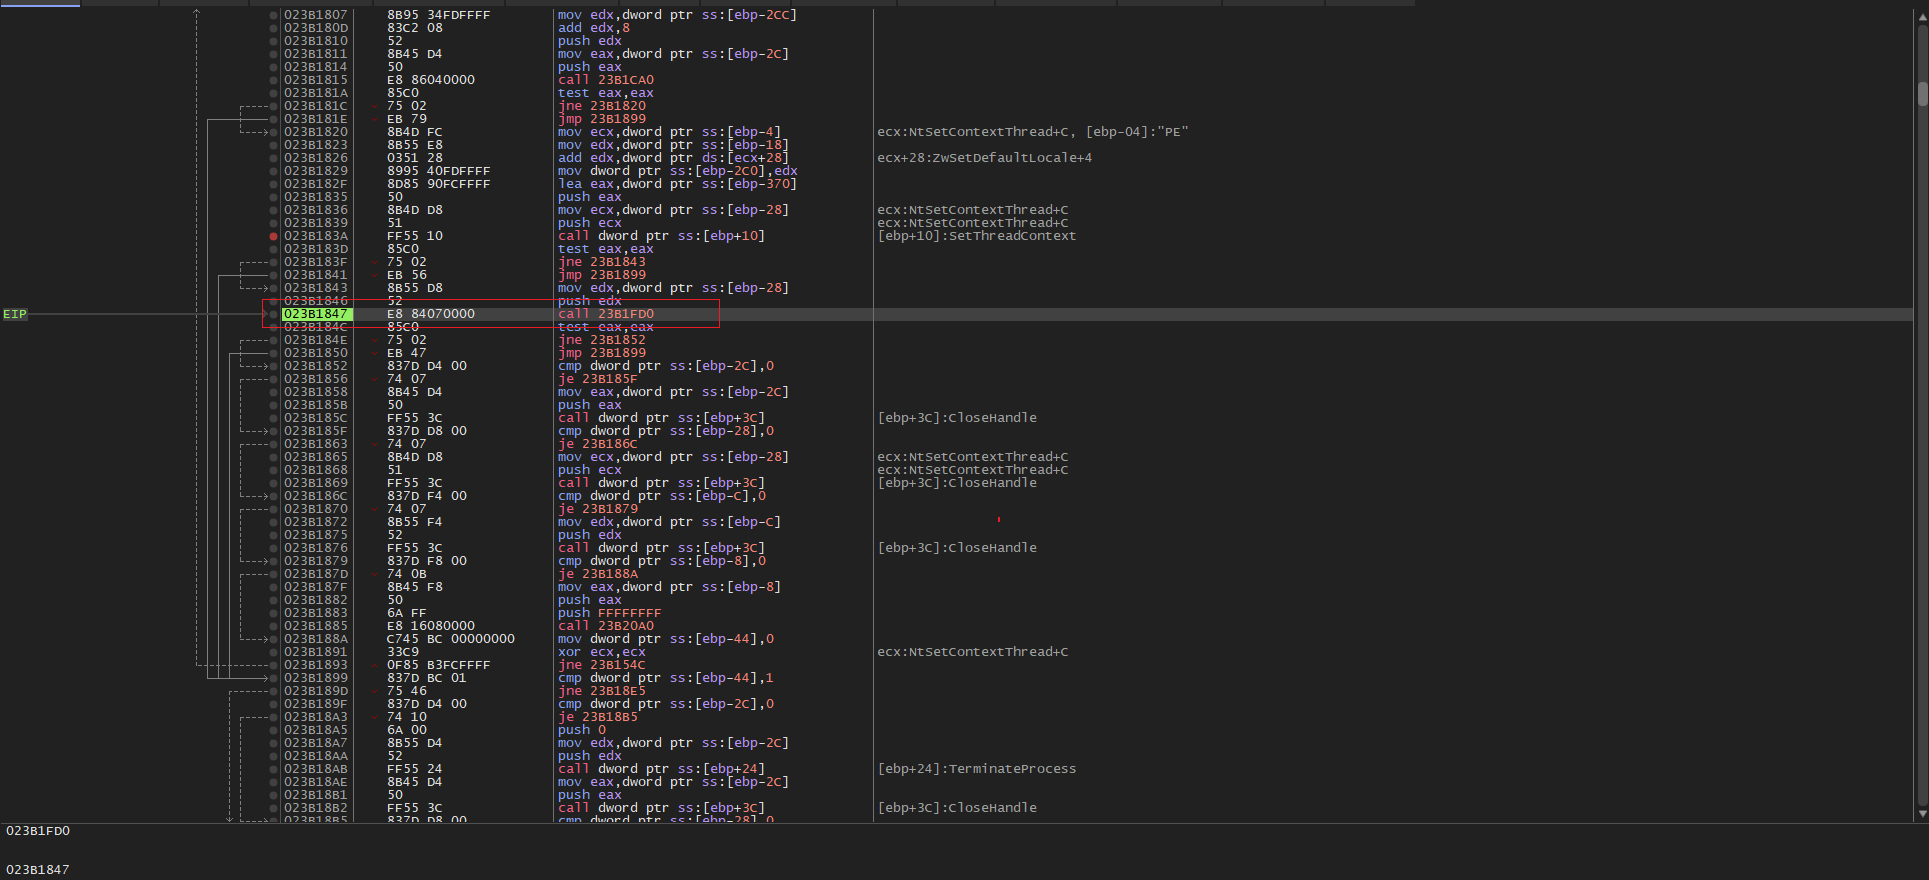
- Going into this function and following the exact same method to pinpoint which function resumes the process I found the culprit for our failed analysis, 0x23B24B0
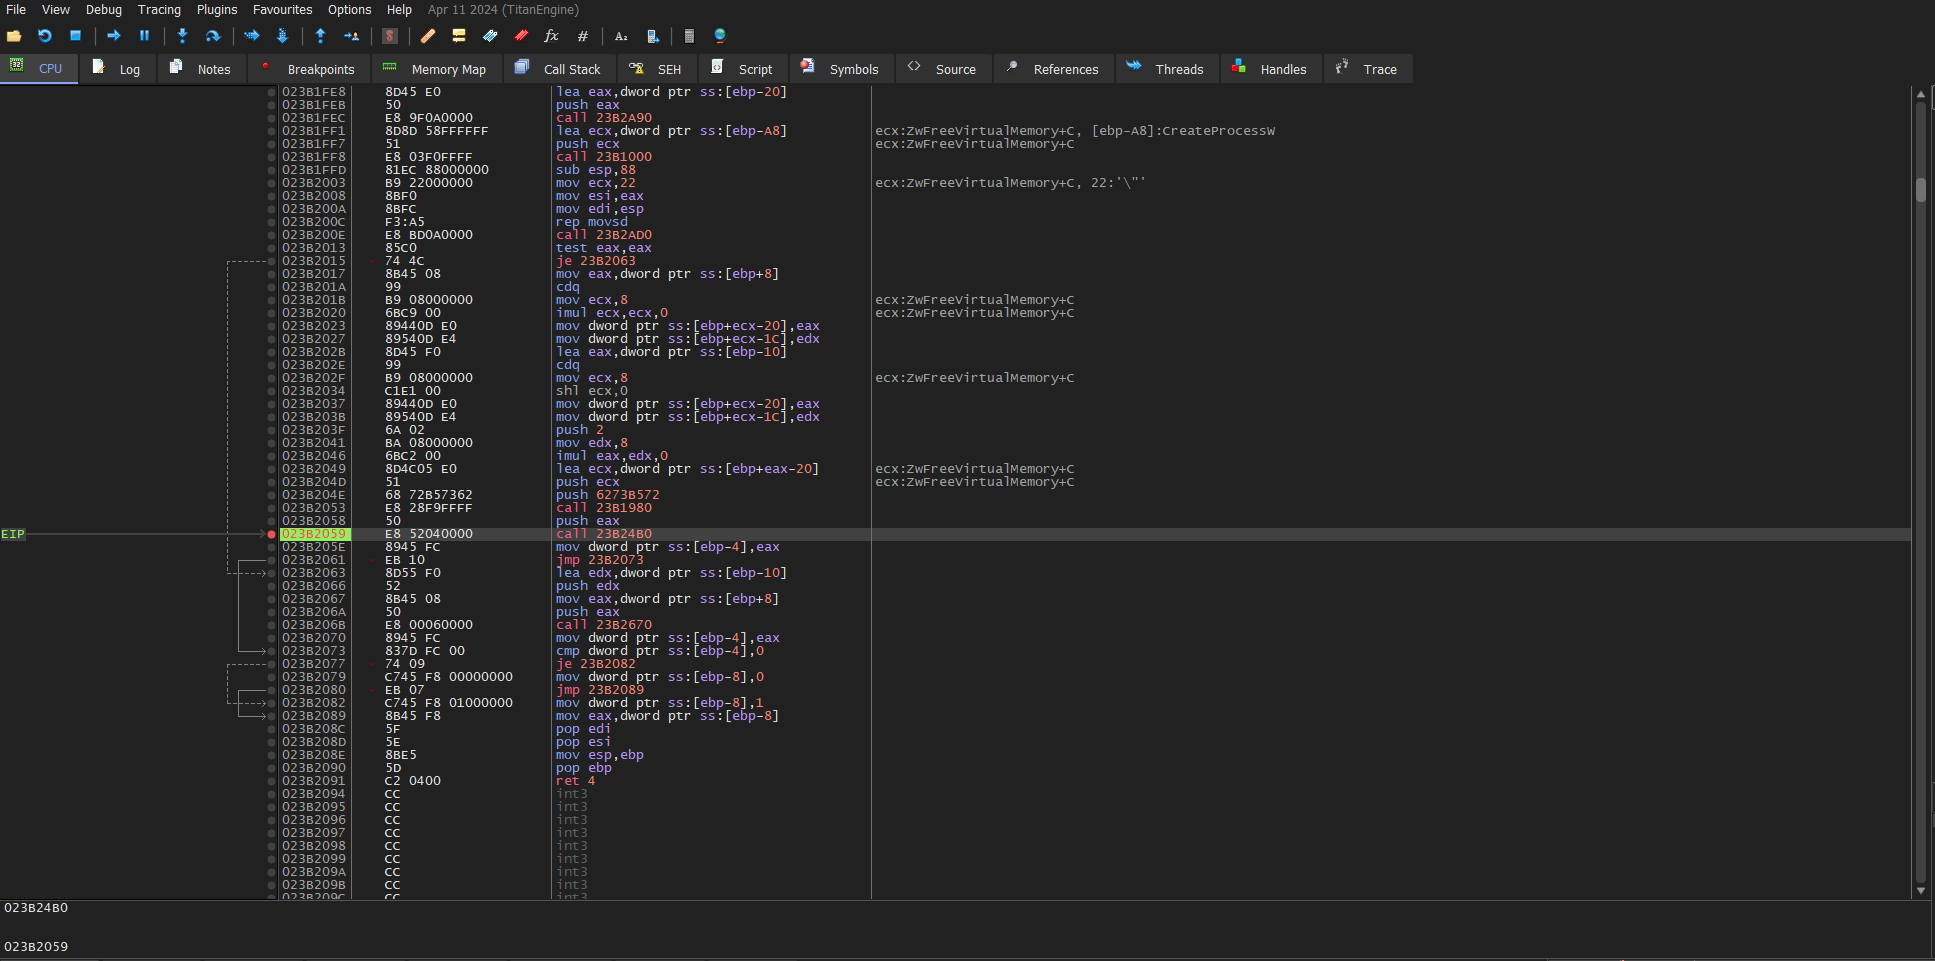
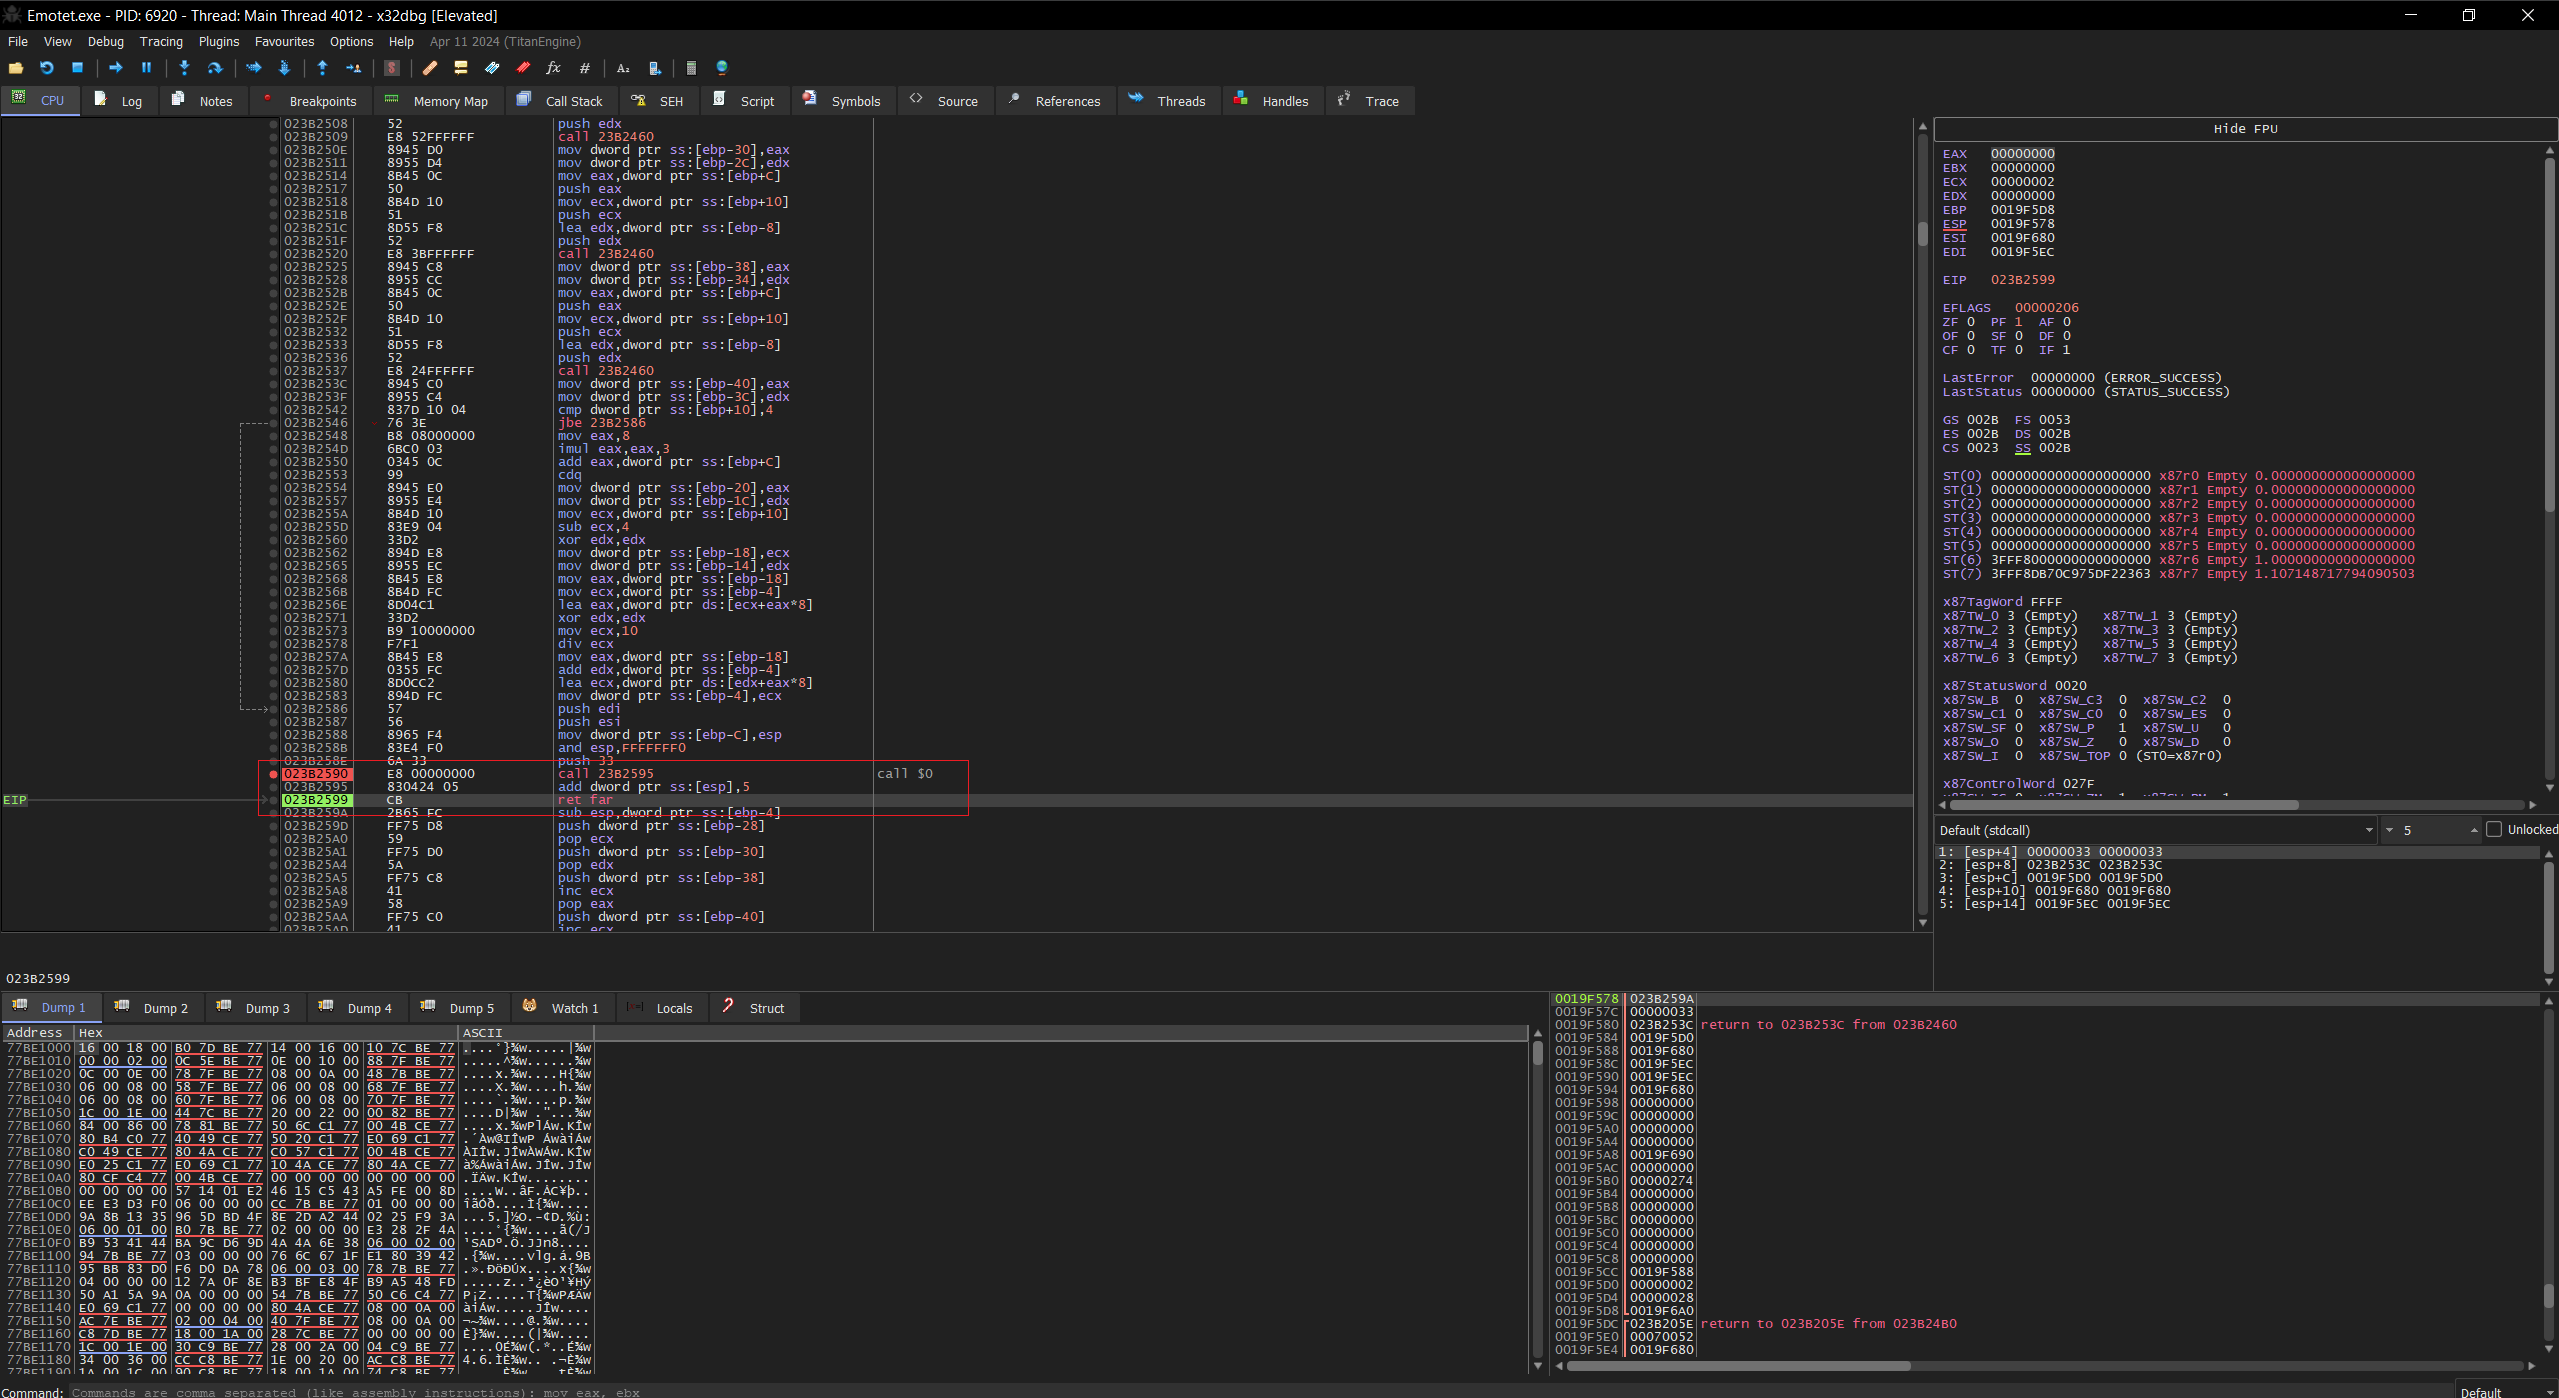
- This function at first glance seems….funky there is a retf or ret far instruction instead of a normal ret instruction and the debugger spazzes out and crashes when we step through the retf instruction. What is happening here? Enter hells/heavens gate.
Tangent - 2 WOW64, Heaven and Hells Gate ⛅
Before we get into heavens gate, we need to understand what WOW or Windows-on-Windows mean.
WOW64 is what allows us to execute 32-bit code in a 64-bit environment. WOW64 is am emulator which acts as the compatablility layer between the 32-bit and 64-bit environments.
This was introduced to allow legacy programs to run on newer versions of windows.
In simple terms, this is responsible for the translation of 32-bit instructions into 64-bit instructions by forwarding the right function calls and executing the right instructions.
WOW is essentially the same as WOW64 except it translates 16-bit instruction to 32-bit instruction. This is not of much use to us but it also follows the same logic as its 64 bit counterpart.
WOW as explained by Microsoft:
The WOW64 emulator runs in user mode. It provides an interface between the 32-bit version of Ntdll.dll and the kernel of the processor, and it intercepts kernel calls.
Now that we know what WOW64 is, we can move into heavens gate.
Heavens gate is a pretty well documented anti-analysis technique popularized in the mid 2000’s. This technique is used to disguise malware and bypass security scanners to deliver a payload.
This works by running 64-bit code in a 32-bit process, this technique levarages the fact that most debuggers cannot follow such change in contexts.
Most debuggers are built to either work in 32-bit or 64-bit environment seperately, not consequently. So when we use a debugger like x32dbg or x64dbg to step through the instructions we cannot follow such context switches from 32-bit to 64-bit instruction set or vice-versa.
To identify this technique we need to understand how windows handles such a switch under the hood.
Within the WOW64 environment, threads that are to be switched from 32-bit to 64-bit mode are sent through the “Heavens Gate” located at the code segment selector 0x0033 via a retf or a ret far call.
We can identify this context switch by the CS register being populated with the value 0x0033 and a ret far call being executed immediately after.
If you look at the previous image you will notice 2 things being pushed into the stack, one is the code segment selector value and then an address that is right after the retf instruction.
Unlike a ret instruction, which only loads the address into the eip, the ret far instruction pulls both the CS segement selector and the address that is to be loaded into the eip.
Now we can move into the improved version of this technique, aka, Hells Gate.
Hells Gate also makes use of the context switch from 32-bit to 64-bit but instead of calling the WOW64 functions directly we load the SSN or the System Service Number from ntdll.dll file and pass the number to the syscall directly to invoke the functions while bypassing the EDR hooks that are normally setup, ensuring stealthy execution of the program.
Instead of calling user-level functions, we bypass all the functions in-between and execute the syscall directly to ensure that no hooks that are commonly set by EDRs are triggered
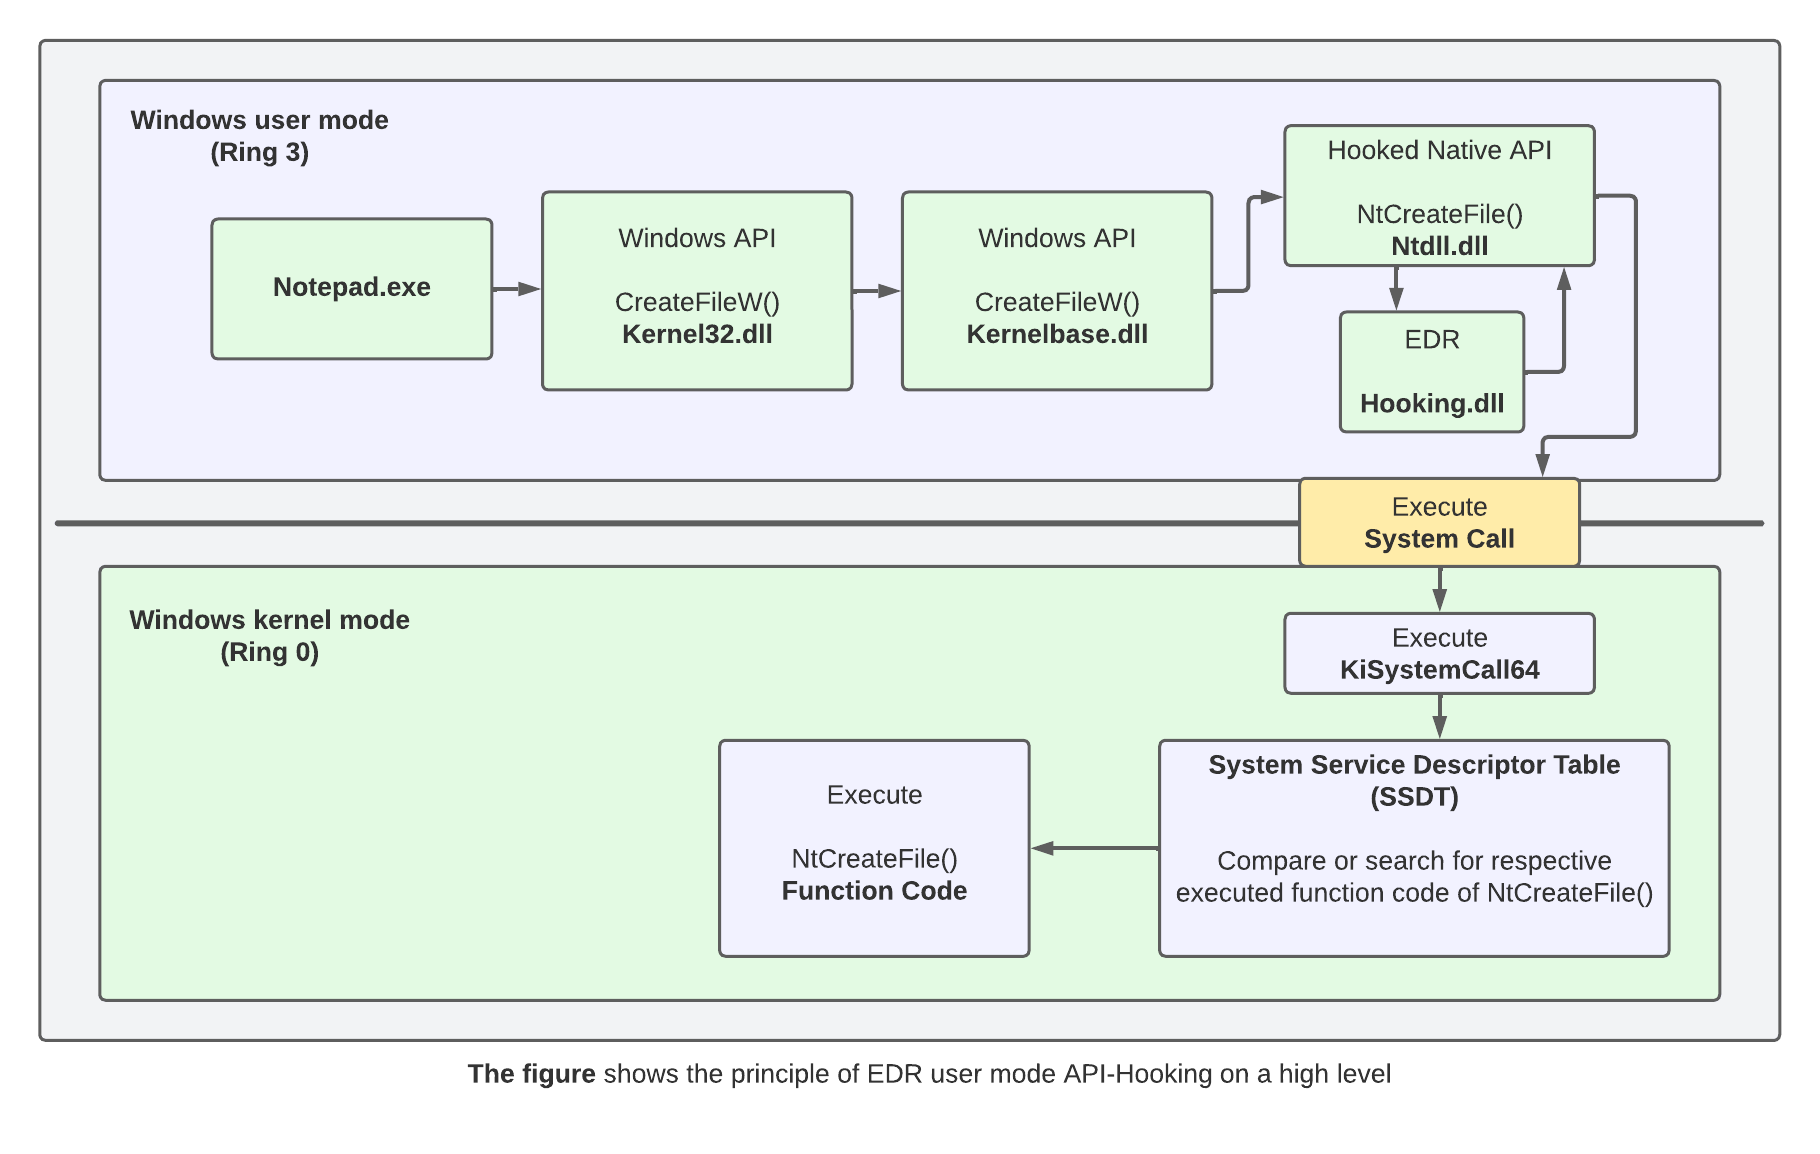 source: https://redops.at/en/blog/direct-syscalls-a-journey-from-high-to-low
As we see from the above diagram instead of executing usermode functions which might get caught in the EDR hooks we execute syscalls and reach the highest privilege levels, allowing stealthy execution.
With that being said Tangent-2 is over (no more tangents, I swear)
Phase-3(Cont… again)
Looking into our funky function we can clearly see the context switch happening from 32-bit to 64-bit(also 64-bit to 32-bit switch which happens further below, it is indicated by the CS selector being filled with 23 instead of 33)
But even if we know what exactly is happening we cannot step through the retf instruction and find out which fuction is being called as our debugger of choice, x32dbg cannot handle it.
Here we use the only tool which can follow such a context swtich which is Windbg(x64).
Windbg is also a debugger similar to x64dbg, but it is a just a lot more powerful. Unlike x64dbg, which only allows us to debug user-level programs, Windbg allows kernel debugging. Another notable advantage that windbg has are the availability of symbols out-of-box, it also has a powerful scripting engine which can be useful in many scenarios.
With all these advantages comes one simple con, its very complicated and the UI is not user-friendly like x64dbg or ollydbg.
But to follow our malware we need the capabilities of Windbg.
First open up windbg, the x64 version and not the x86 version, otherwise our debugger cannot follow the switch(btw, use windbg classic and not the new rewritten version, you can download the tool with Windows SDK, more info here, I dont know why the new version gives me trouble when I try to follow the switch :P) and attach the executable.
After attaching the executable you should see a screen similar to this..
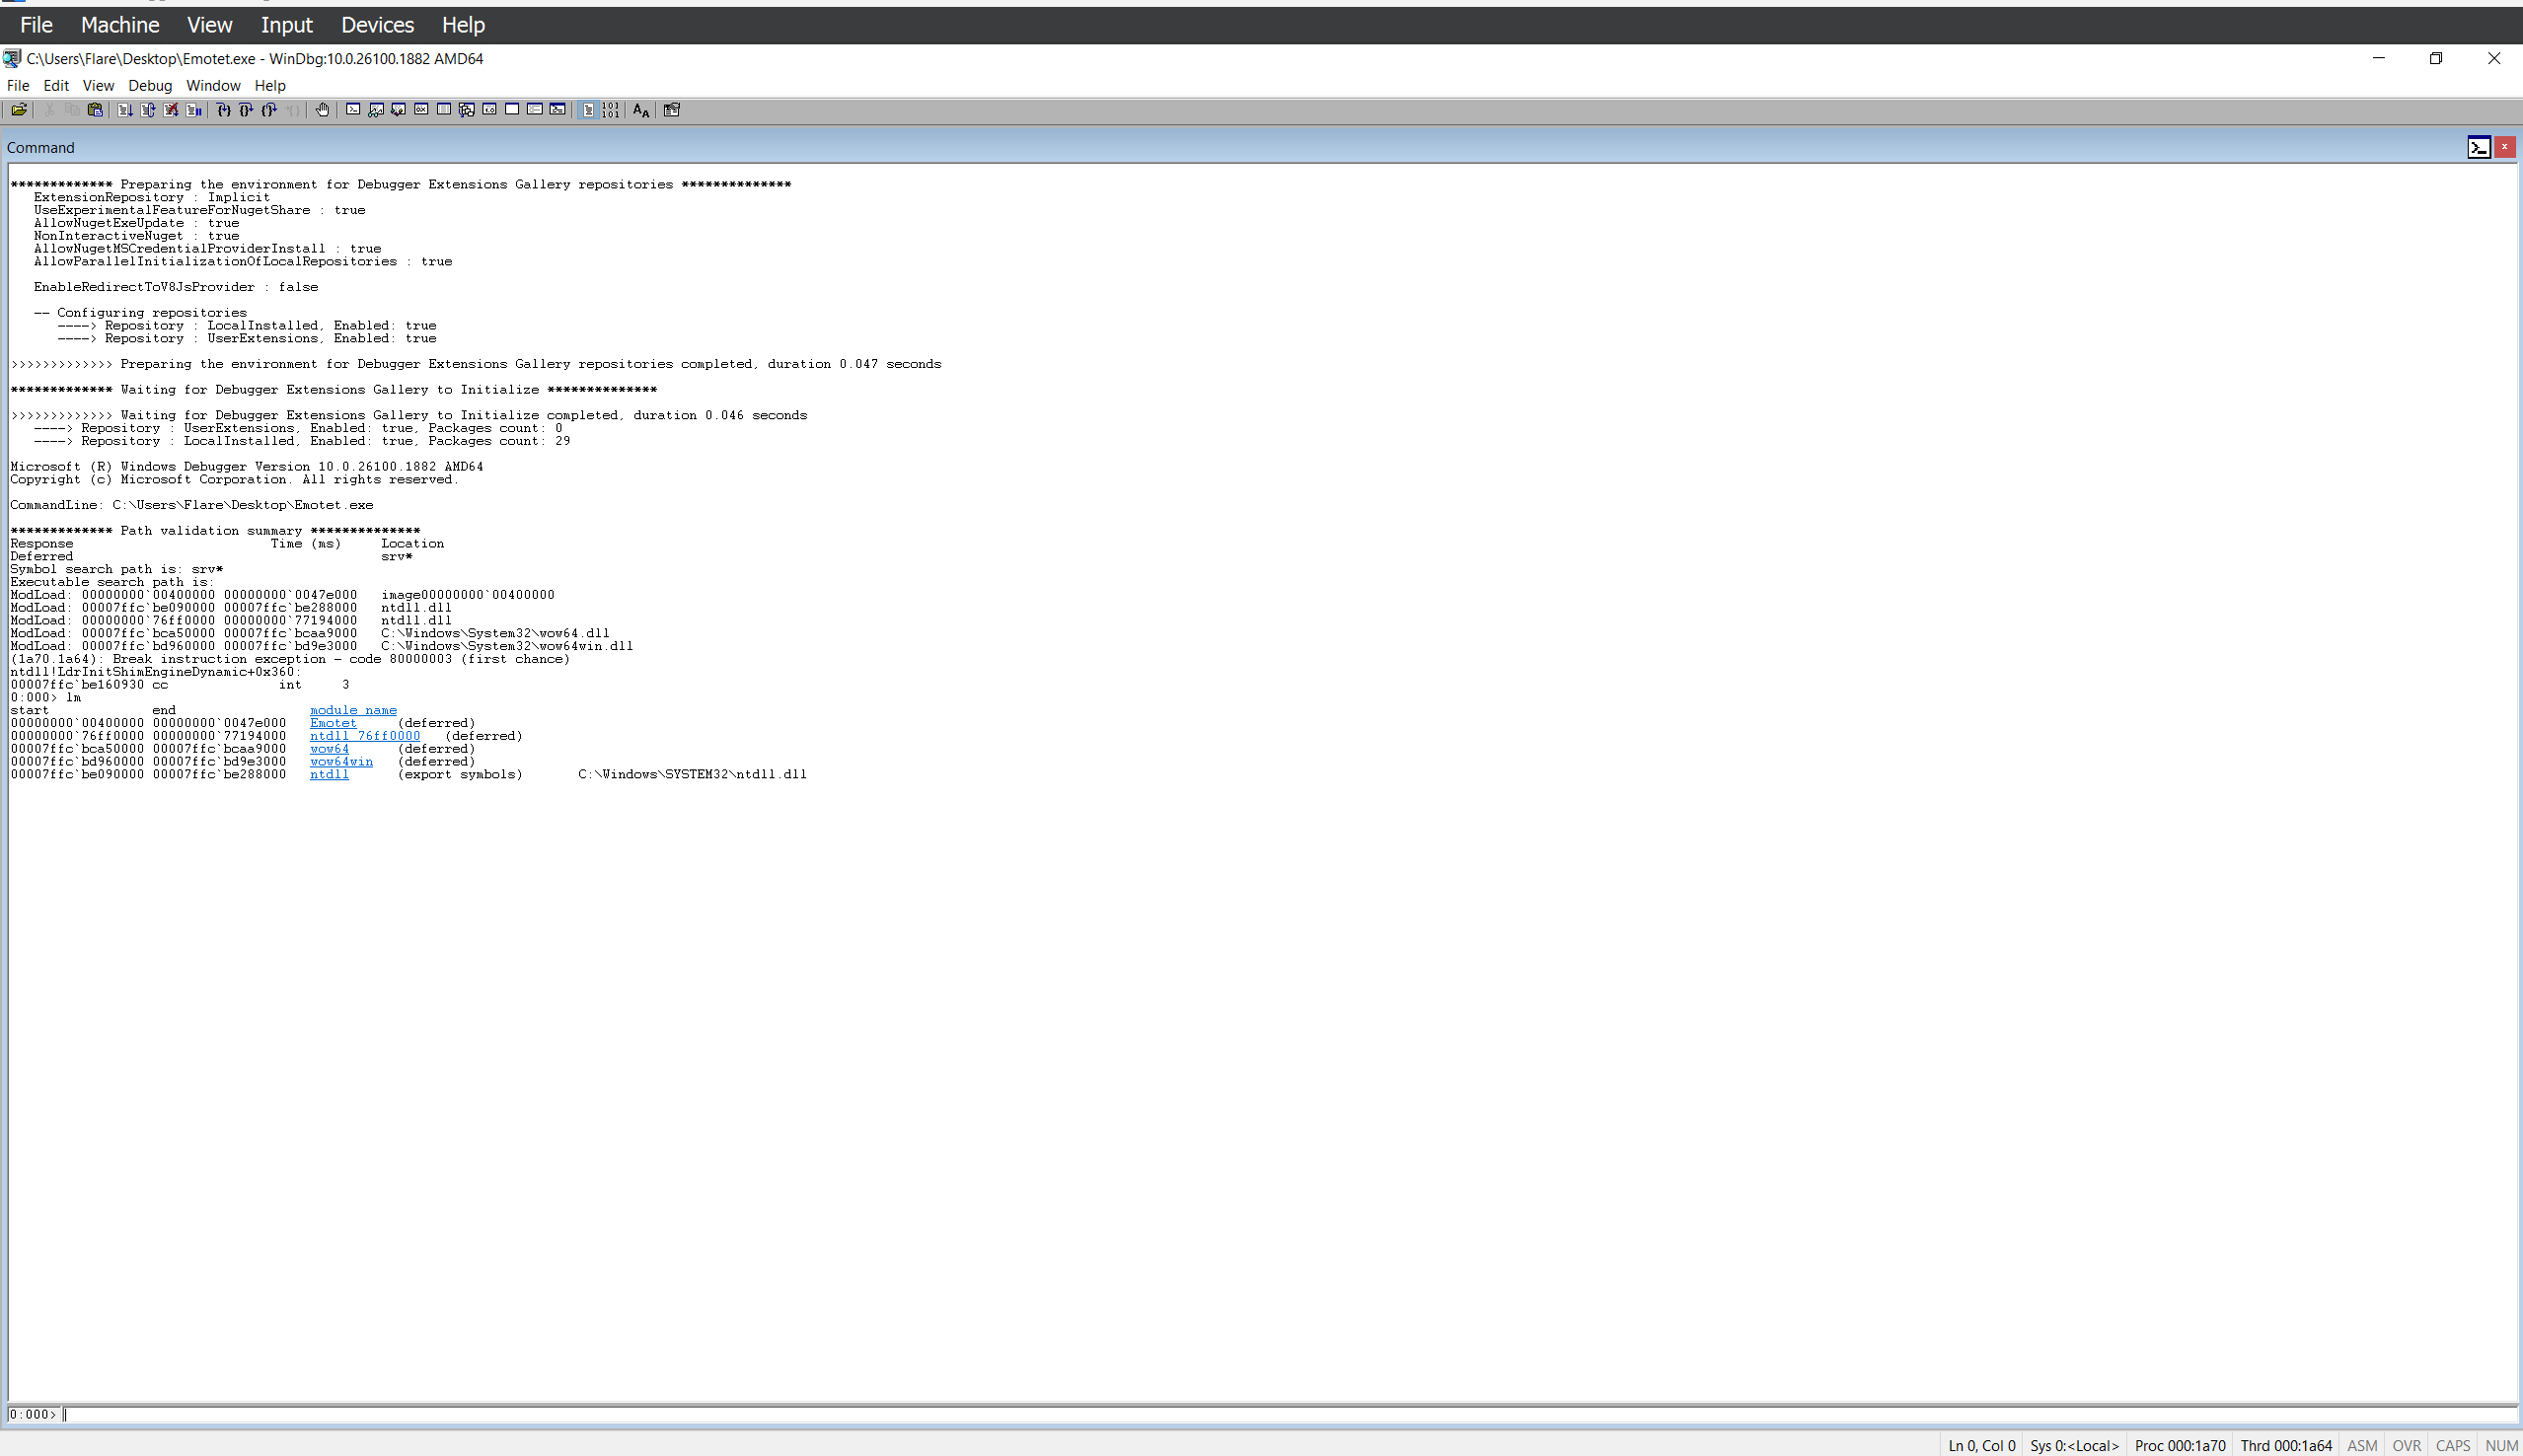
I have also listed all the linked modules that this program uses and we can see only a few dlls being imported. this is because the program has not been fully loaded and we have yet to reach the program.
To view all the linked modules we first have to move into the main function, to do this we can set a breakpoint anywhere inside the program and run it.
To set a breakpoint, we can use bp {address} (there are many types of breakpoints that you can set, conditional breakpoints, hardware breakpoints etc.. I’m just using this) eg. bp 0x00403b6a, if you remember this address is the final call esi function that was called at the end of our main function in Part-1.
After setting up the breakpoint we can use g to continue the execution until we reach the breakpoint, now we can see all the linked modules using the command lm.
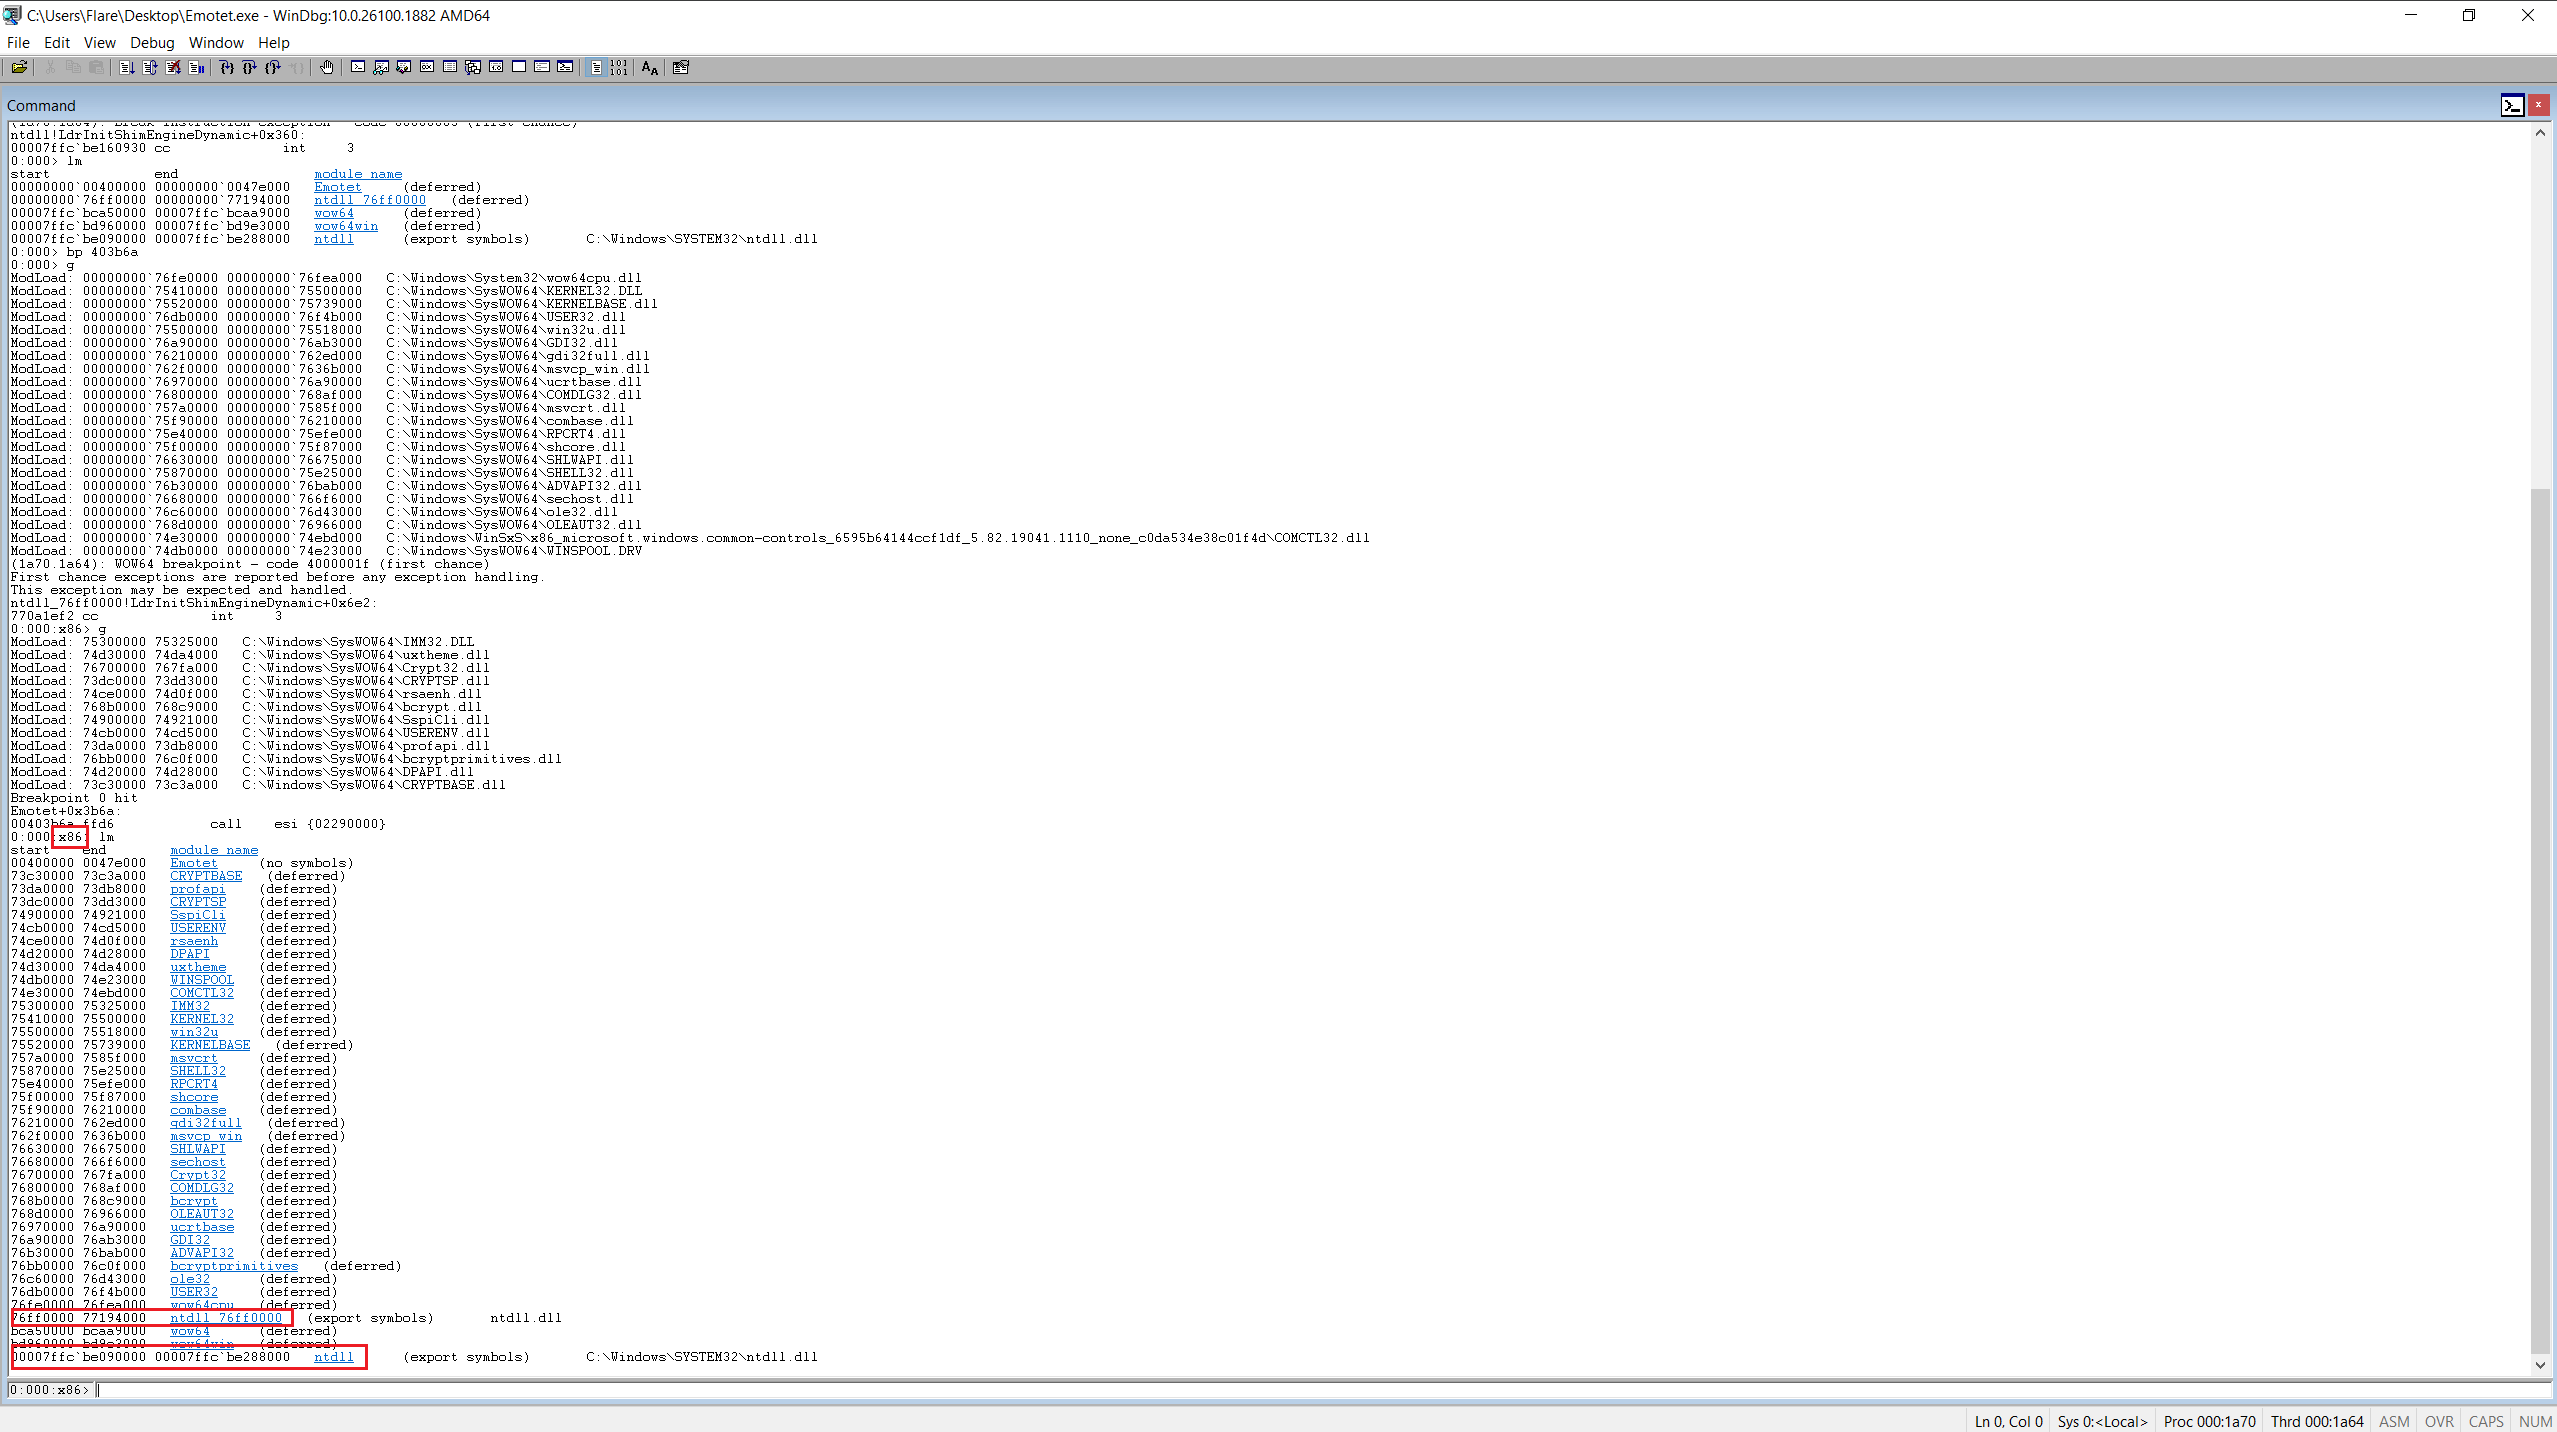
- We can observe many curious things in this window,
First, the debugger recogonizes this as 32-bit code and runs accordingly even if we are executing this in a 64-bit debugger, this is due to WOW64.
Second, we can see that there are 2 ntdll files, these are the 32-bit and 64-bit versions of the same ntdll file as indicated by the start and end address, one is in 64-bit address form and the other is in 32-bit form.
Next we need to reach the hells gate function which resumes the program, to do that we can look at any static indicator from our offending function.
I noticed a SetThreadContext() call right before our function, we can set a breakpoint at the entry of the SetThreadContext(), exit it, and go into our function.
- To keep a breakpoint at the entry of SetThreadContext, we can use the command bp KERNEL32!SetThreadContext, after setting the breakpoint we can hit g to continue the program till it hits the set breakpoint.
you can use bl to view all the set breakpoints and bd {breakpoint number} eg. bd 1 to disable breakpoint 1.
- After reaching the breakpoint we can get out of the function by using gu, now we are close to the function that we actually want to check out, to view subsequent instructions use command u or u . l {no. of lines to view} eg. u . l 50 to view 50 instructions.
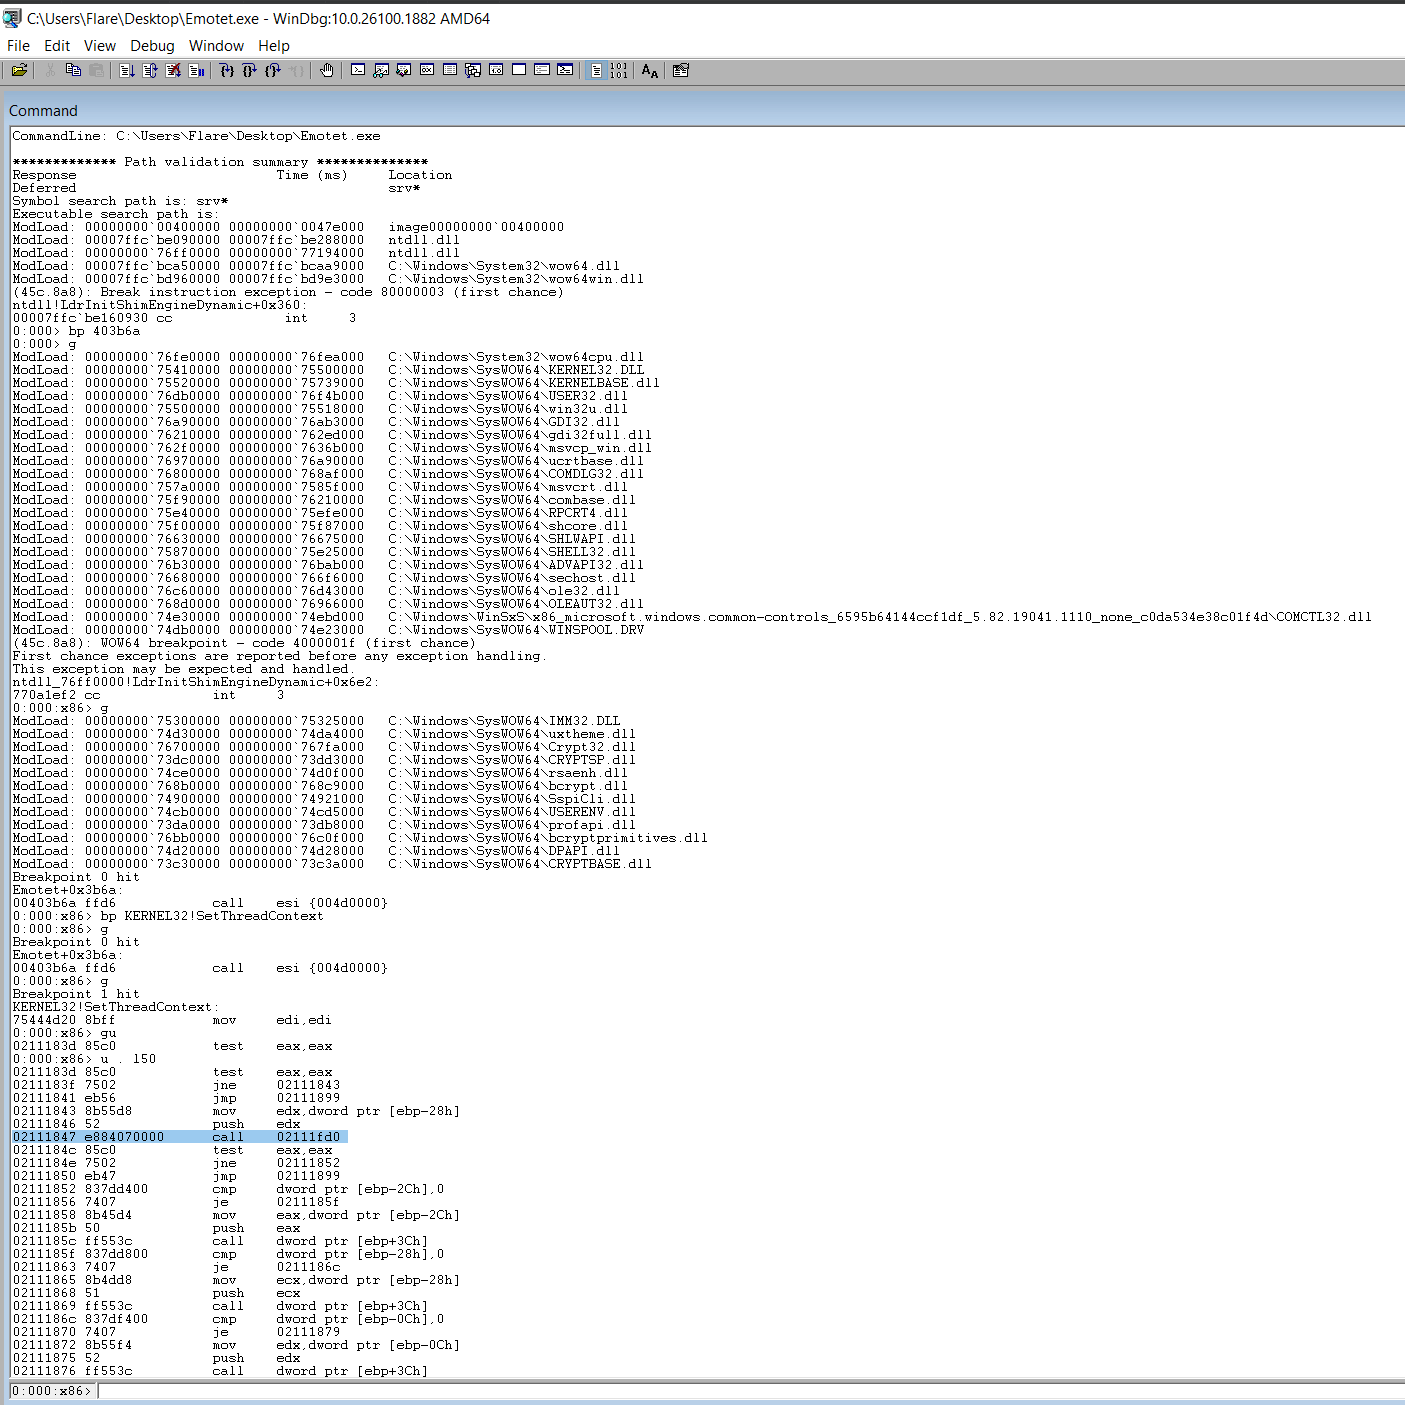
To do a step-into action you can use t, now we can reach the function easily, after moving into the function we again have to find the function that houses the hells gate technique.
We list the whole function by using u . l50, set breakpoint at the function and press g to reach the breakpoint.
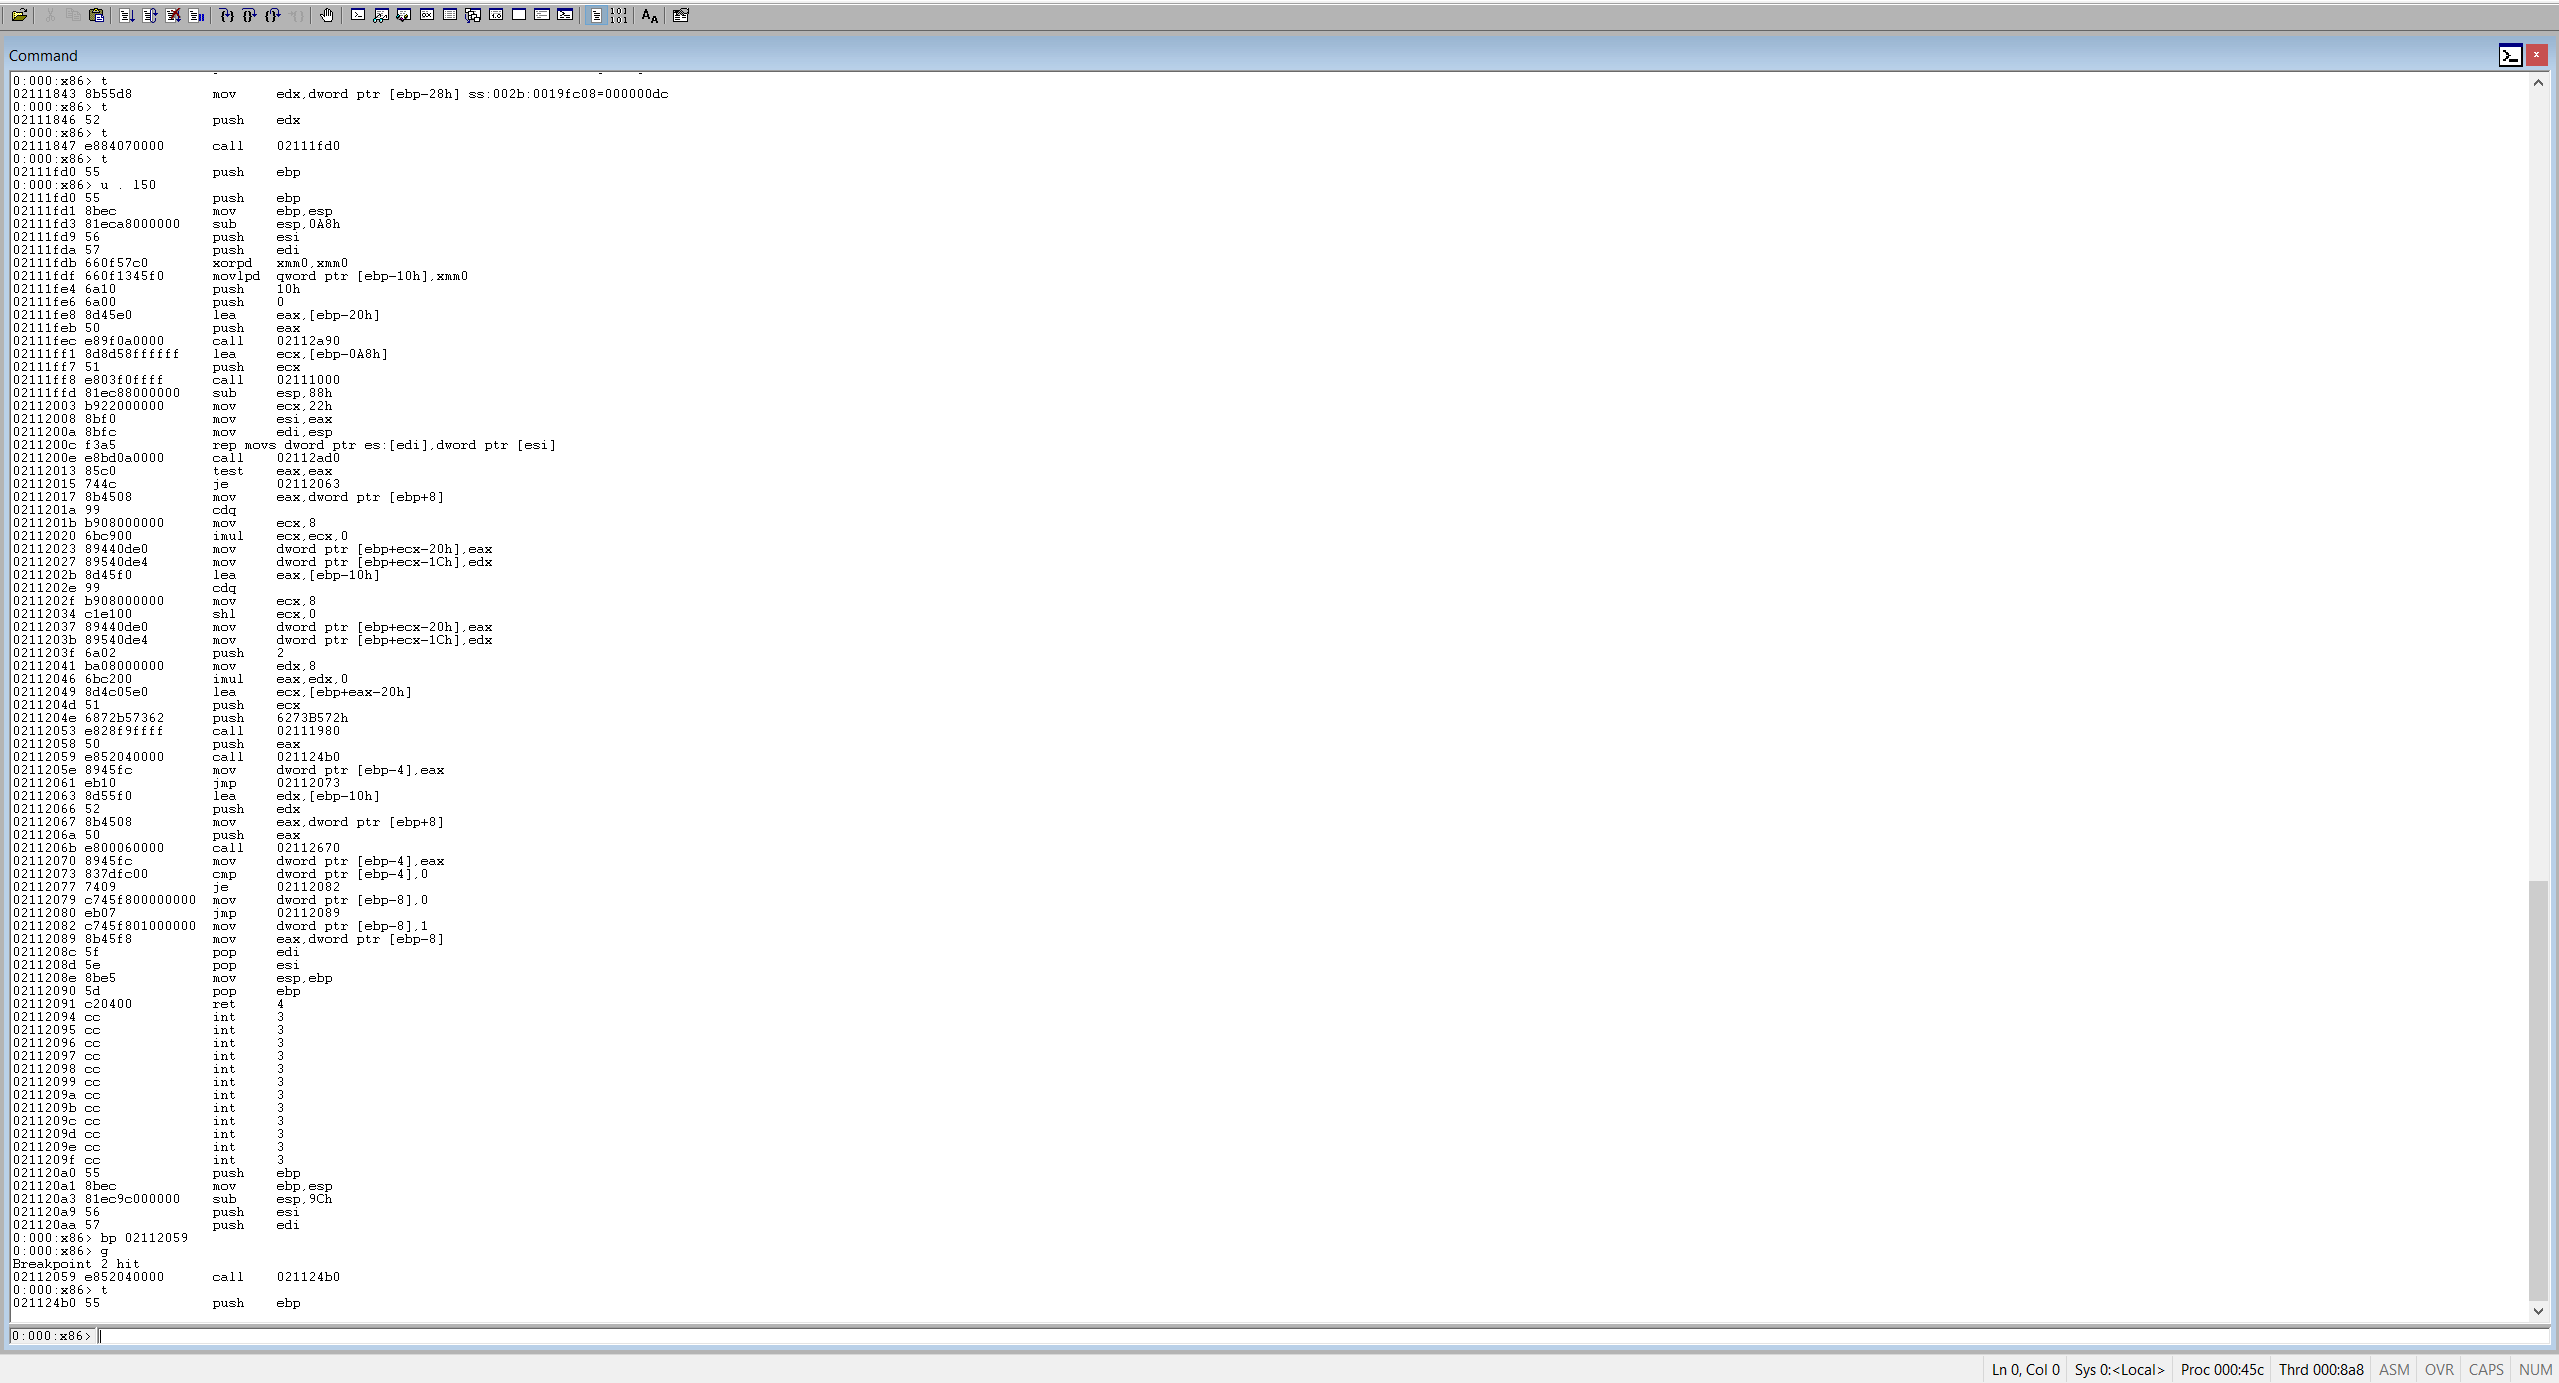
- Stepping into the function we can see the anomalous retf/ret far function, we set a breakpoint there and we go.
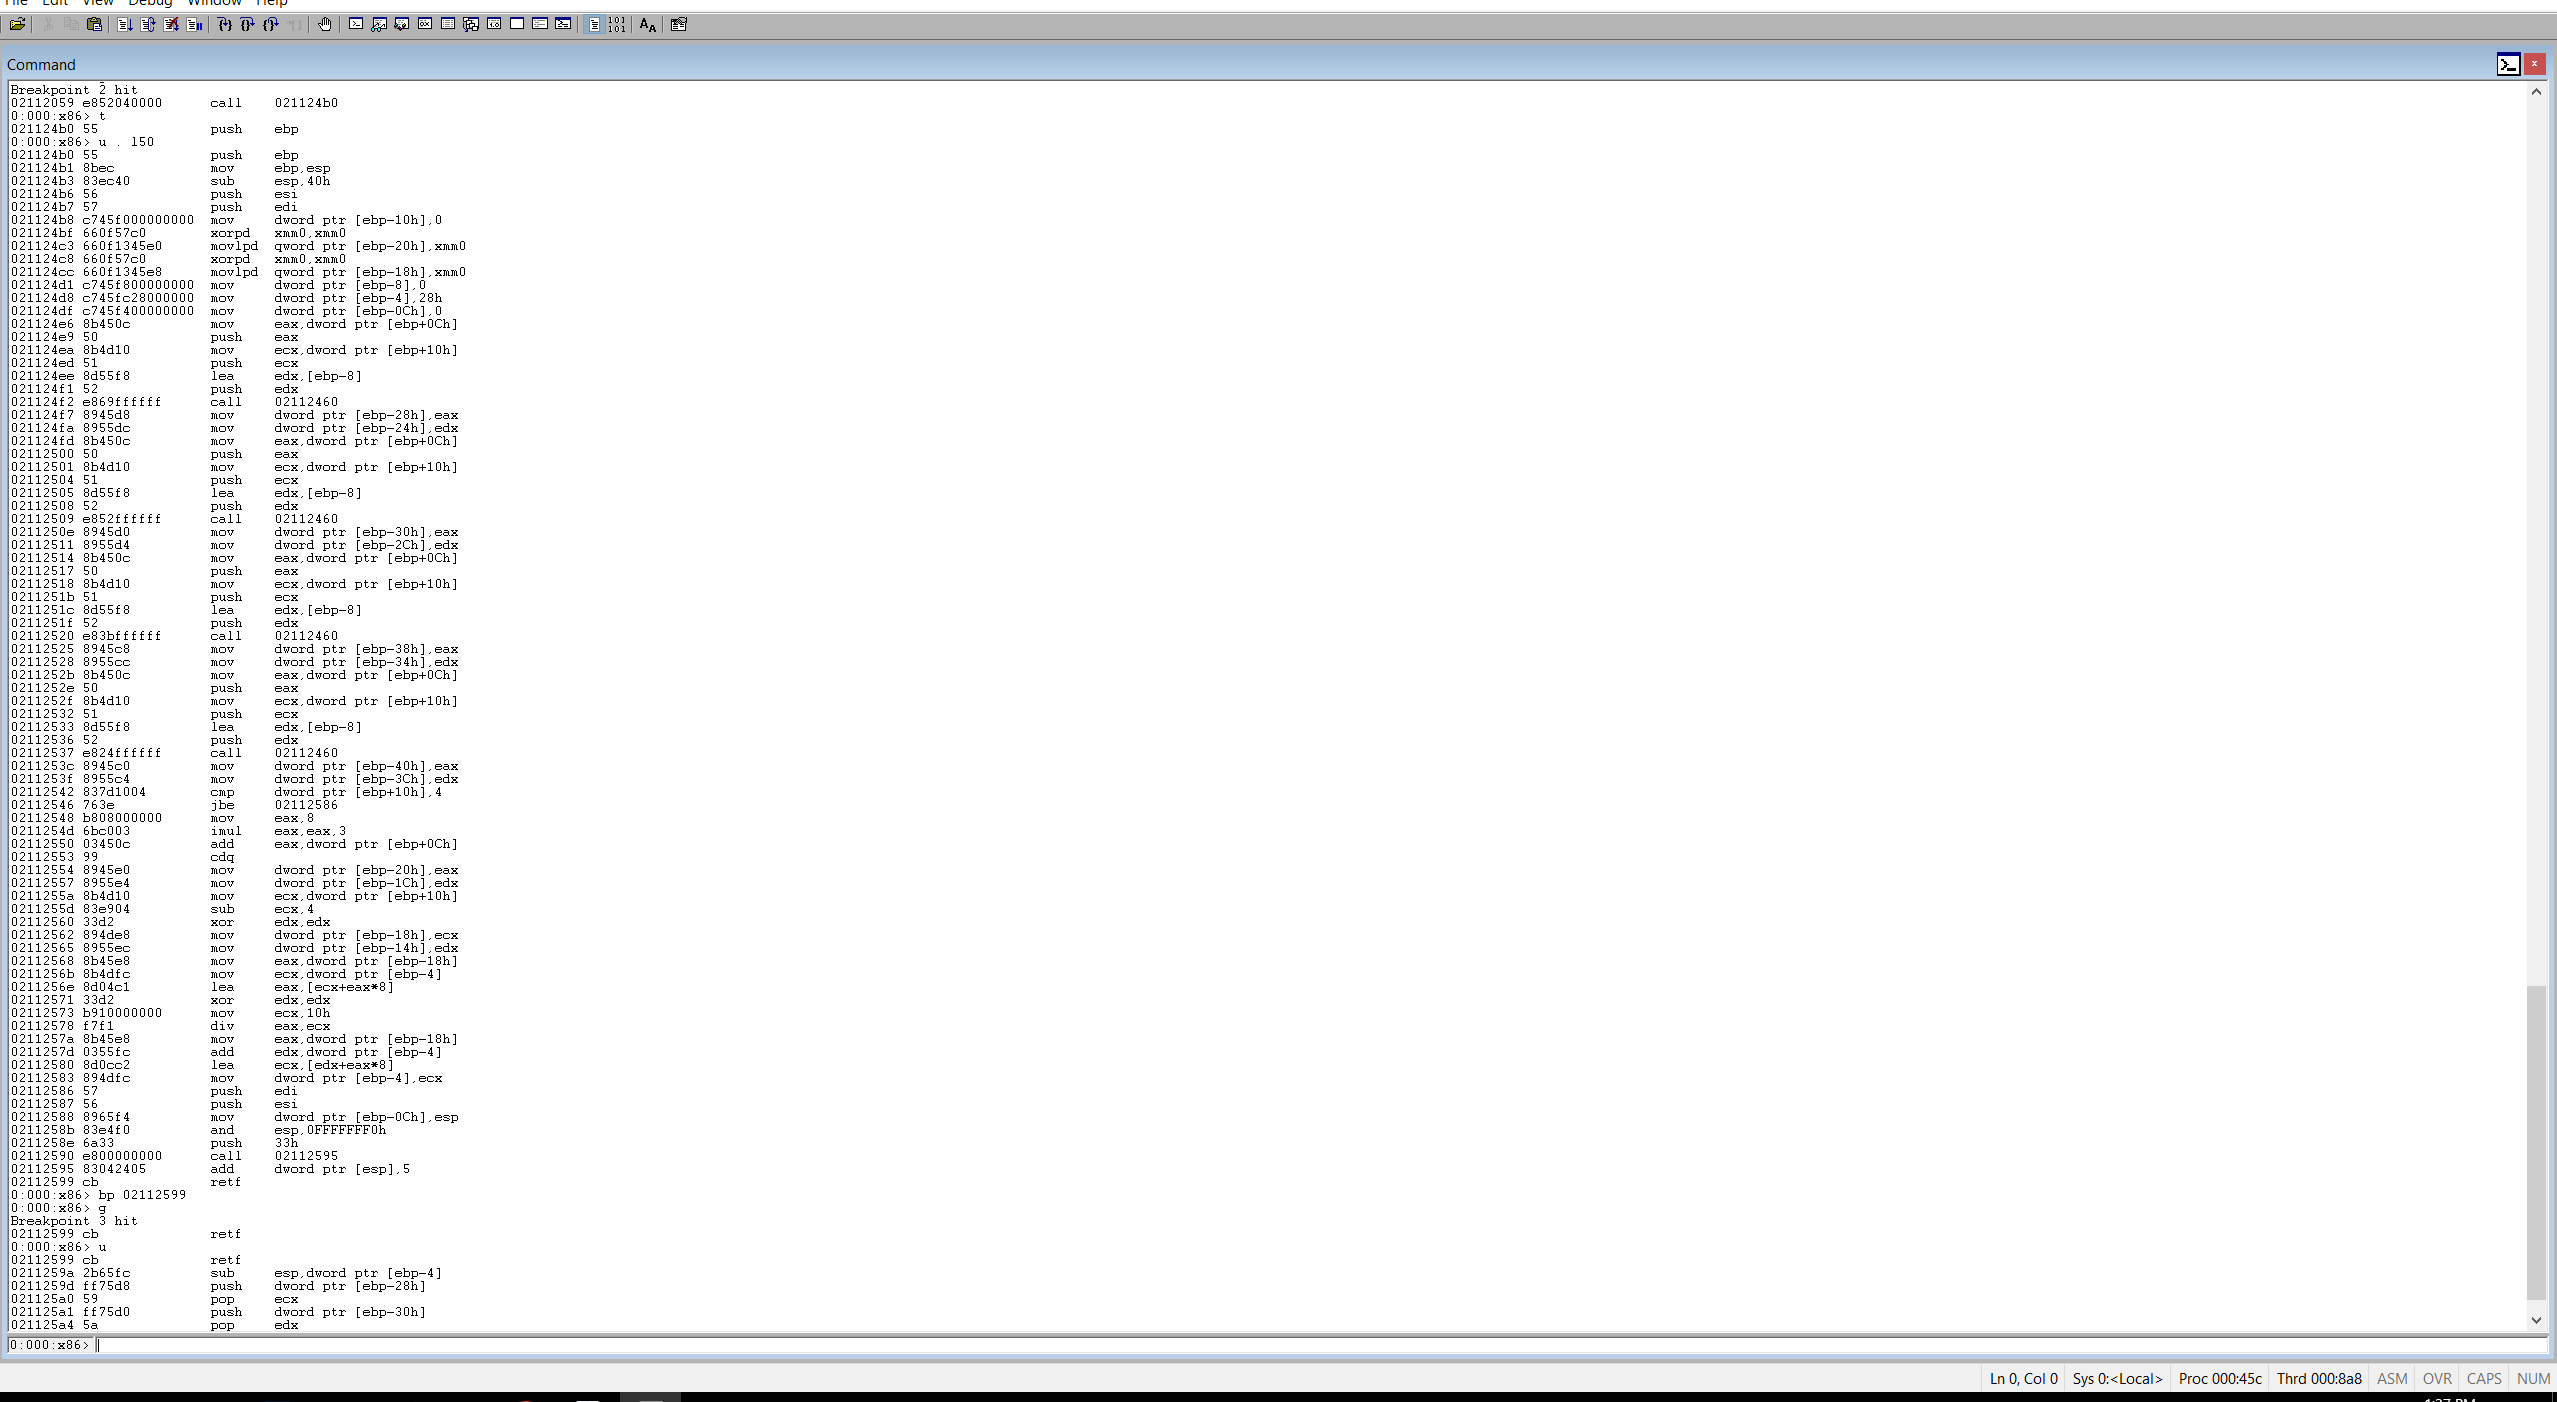
- Now if we step through the retf instruction, unlike x32dbg, we can see the switch from 32-bit environment to 64-bit environment.
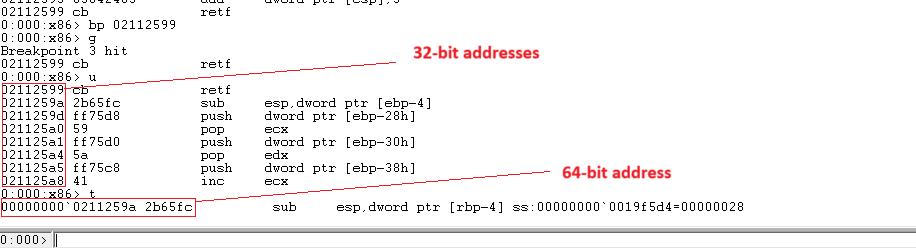
Whew! now that we have moved passed the hells gate we can see what function is executed, it should be ResumeThread(or the syscall equivalent of that function).
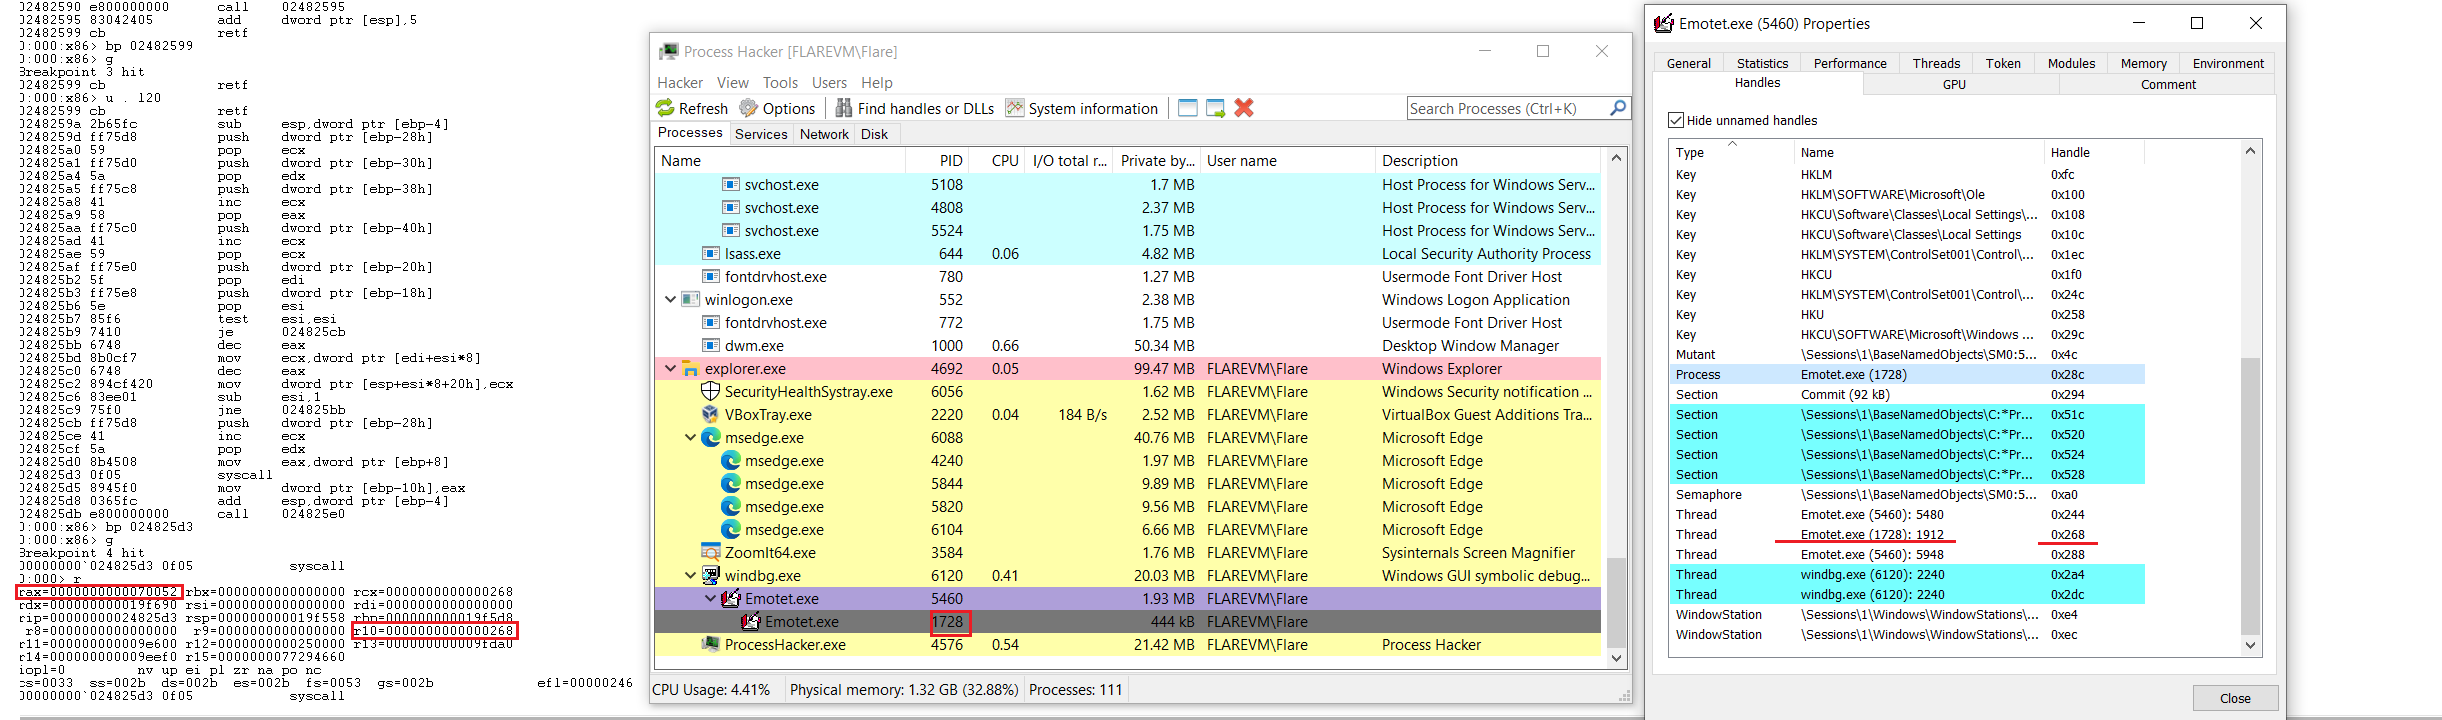
To find out the function, we need to find out the SSN number that is passed to the syscall instruction. We first move to the syscall instruction and find out whats in the rax register which houses the SSN. And we can view rcx/r10 to get the handle of the program that is to be resumed(if you are wondering why these registers in particular, its just Window’s x64 calling conventions)
We can see that the register is filled with 0x70052, this corresponds to the NtResumeThread api call, although I was unable to confirm this through the well documented Syscall call table the last 2 bytes are the same.(we can confirm this by the blog post about pony malware, where a similar technique is used. Also executing this syscall resumes the program, I think that should be proof enough)
Now that we have an idea of how these functions are executed we can stop the program before its memory is overwritten and dump it.
This sample reuses this subroutine everytime it needs to do some syscalls(a.k.a important api calls like WriteProcessmemory or something), we can set a breakpoint at this function(the hell’s gate function) and everytime this function is accessed we can easily move to the syscall, examine the rax registers and find out the function and parameters.
Doing so I was able to observe this flow of events
| Event No. | SSN | Corresponding API call | What does it do? |
|---|---|---|---|
| 1. | 0x2a | NtUnmapViewOfSection() | Unmaps the existing view of the section that is passed |
| 2. | 0x4a | NtCreateSection() | Creates a new section with custom permisssions |
| 3. | 0x28 | NtMapViewOfSection() | Map a section to a process at a given address |
| 4. | 0x28 | NtMapViewOfSection() | Map a section to a process at a given address |
| 5. | 0x3a | NtWriteVirtualMemory() | Similar to WriteProcessMemory, basically writes data at a given address |
| 6. | 0x70052 | NtResumeThread() | Resumes a thread |
If we look at this flow of events , we can notice that its not the same as the Process Hollowing event flow we discussed above in Tangent 1.
What is this doing? Well, I’m not quite sure about the name of the technique but I believe its called Reflective Code Loading.
In simple terms, we create a shared section that can be accessed by both the programs. The original process(the one which contains that PE file to be loaded) creates a section, maps both the current process and the child process to the same section and the parent process can now write stuff to this section, which will be reflected in the mapped address of the child process.
A great article to get a good idea of how this technique works.
If we observe Event no. 2,3 and 4 we can get a good idea of whats happening.
First NtCreateSection is called, this done to, well…. create a section and we also get the handle to the created section.
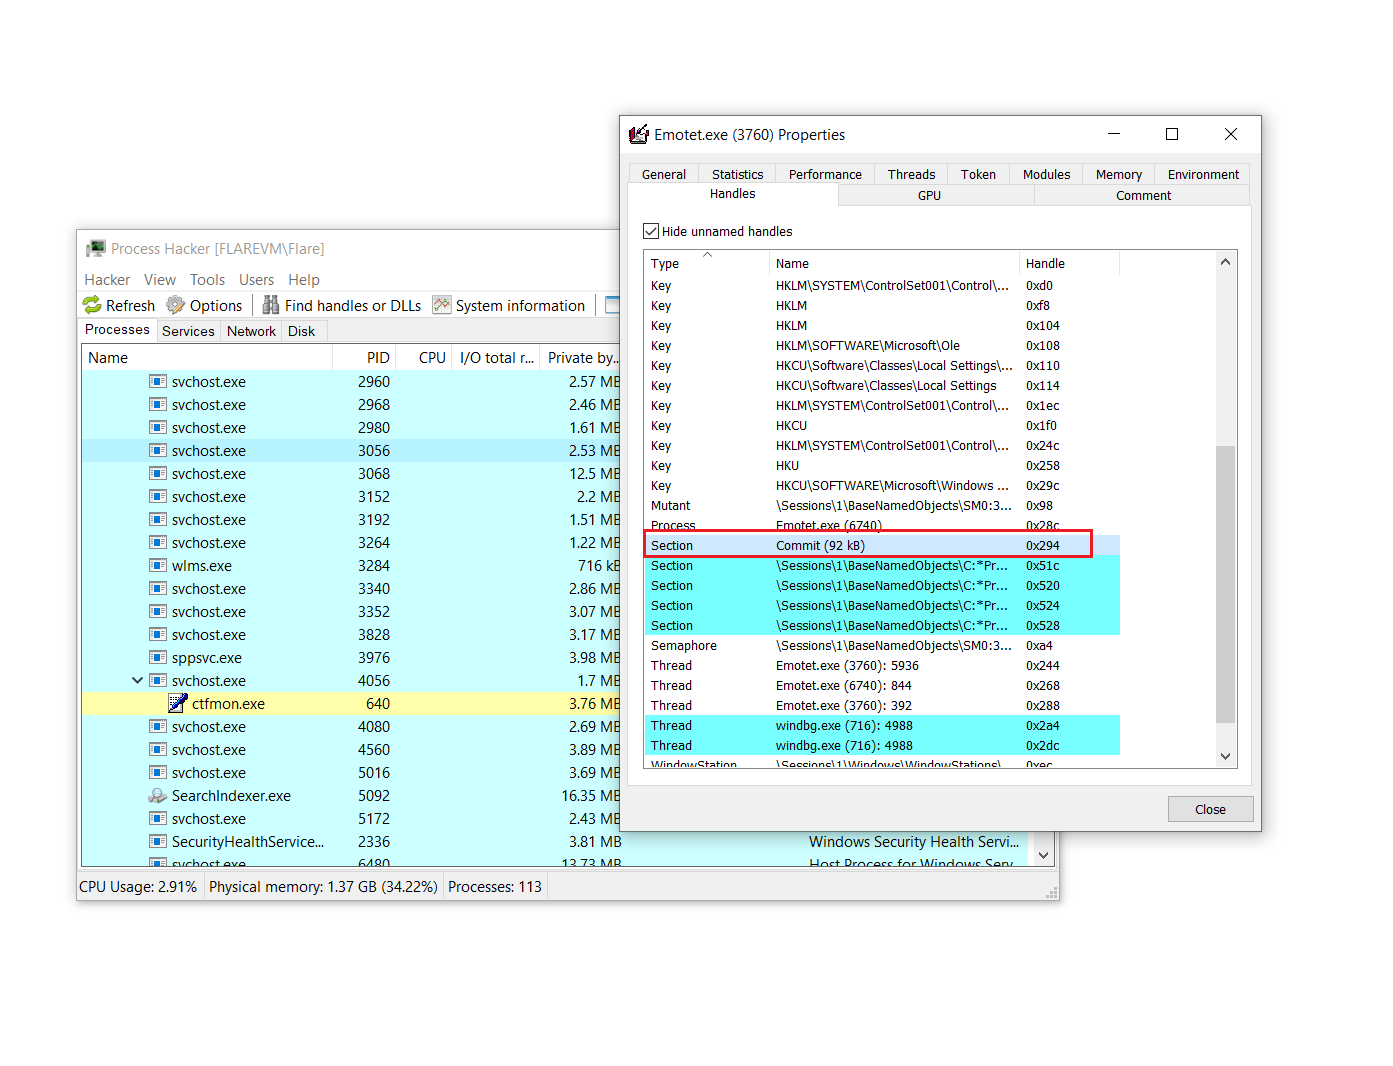
- After this we can see 2 calls to NtMapViewOfSection
- The first one is done to map the newly created section to the child process.
- The second one is done to map the view to a address in the current process
- To identify the addresses that are mapped, we have to examine the r8 register(again r8 because windows x64 calling convention), the first call maps the section to the address 0x400000
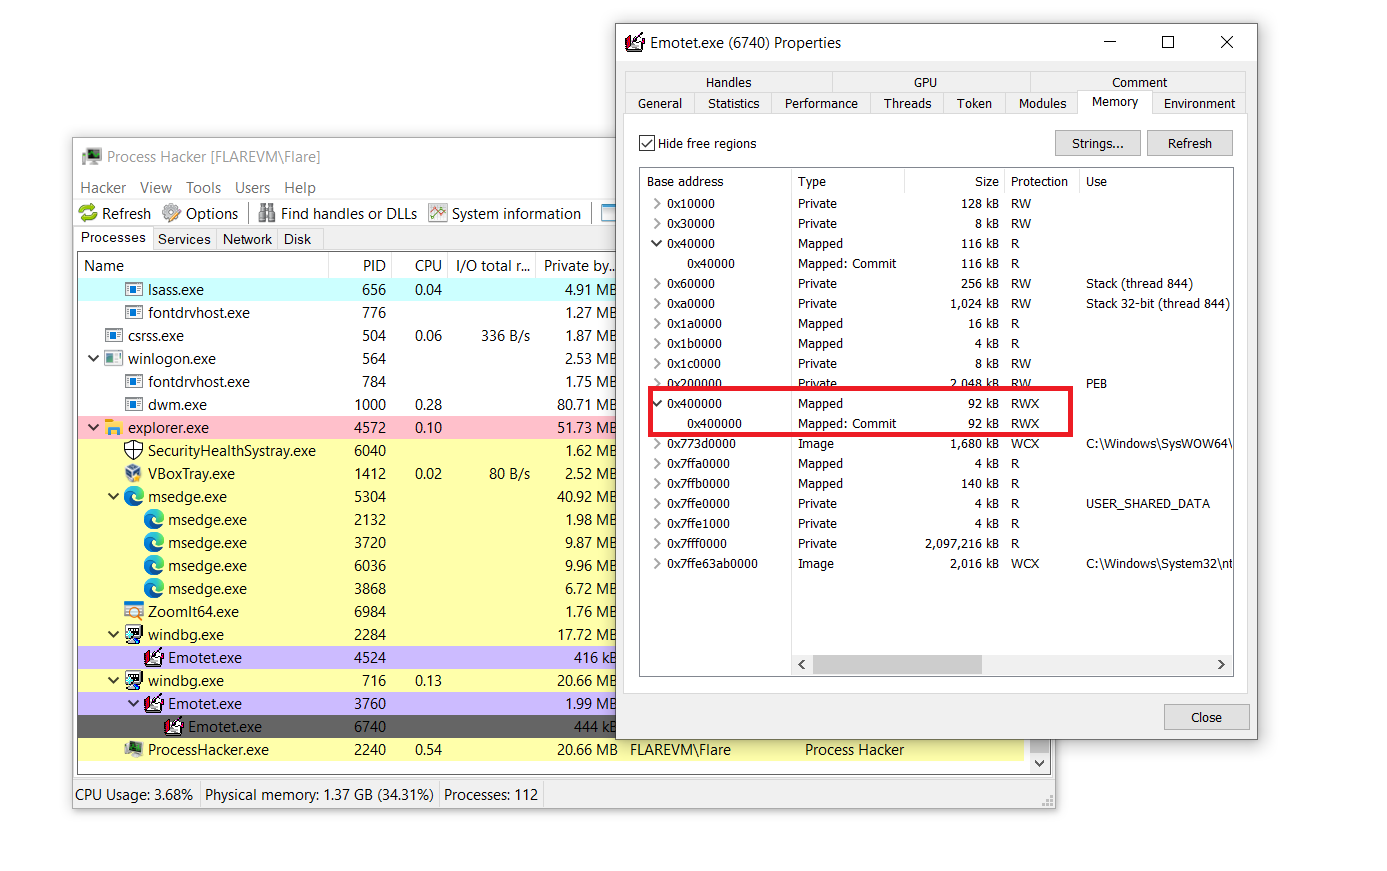
The r10 and rdx contain the handles to the section and process respectively(0x294 being the section handle and 0x28c being the child process handle)
We can also notice that the second function has the section handle but the process handle section contains the 0xffffffffffffffff, this is a common macro for indicating current process so instead of a handle, the fuction has been passed the api GetCurrentProcess().
And examining the address register r8 we can see that its empty, this means that the funcction is responsible for the allocation of the memory and the address at r8 gets populated after the syscall.
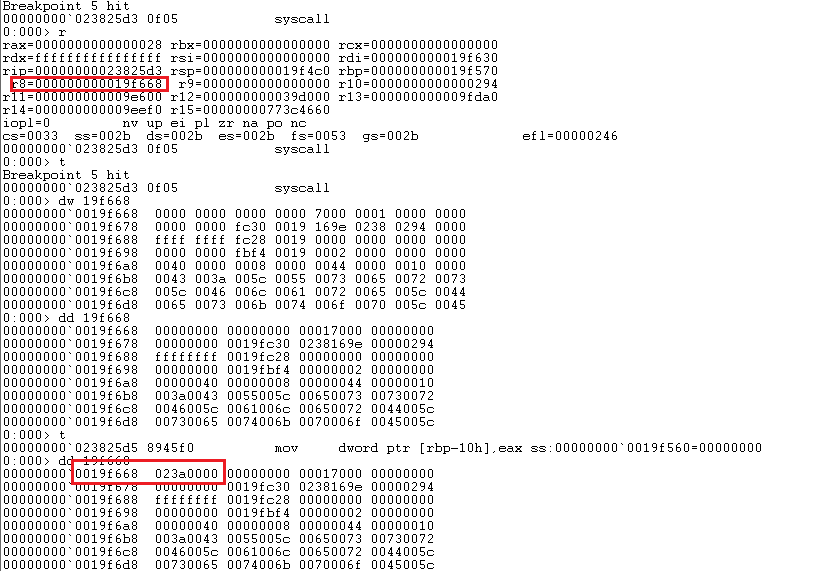
- To confirm we can see the address having the same size with RWX permissions set.
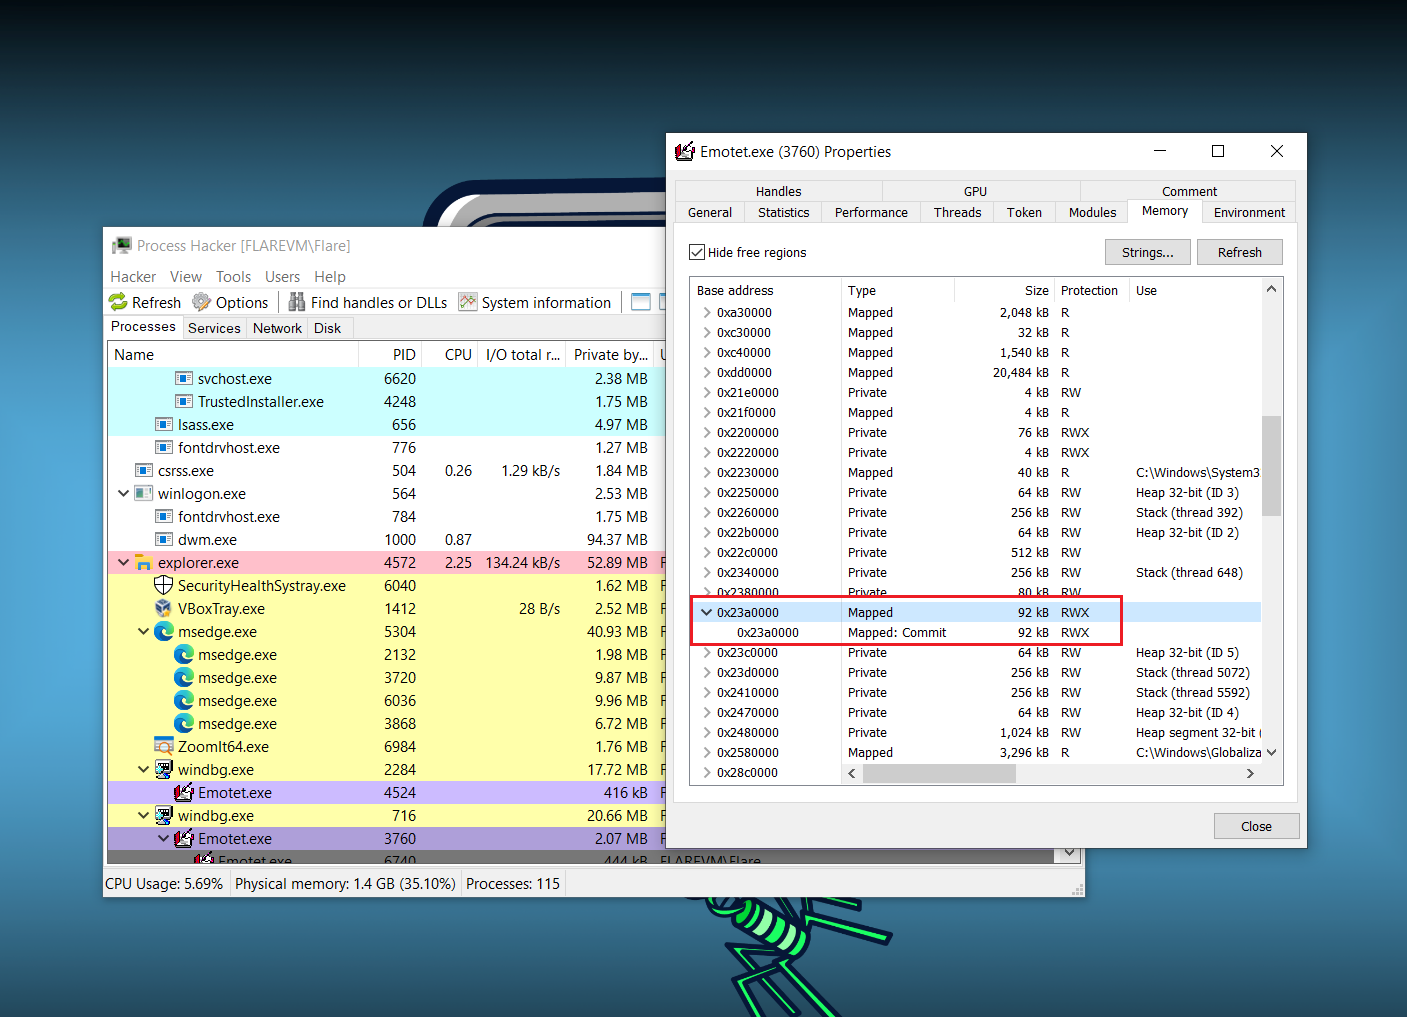
If we examine this address we can see that its completely empty, We can make a relatively educated guess that the exeuctable is now going to fill up the section, set the thread context and resume the program.
Here is the overview of all the important calls,
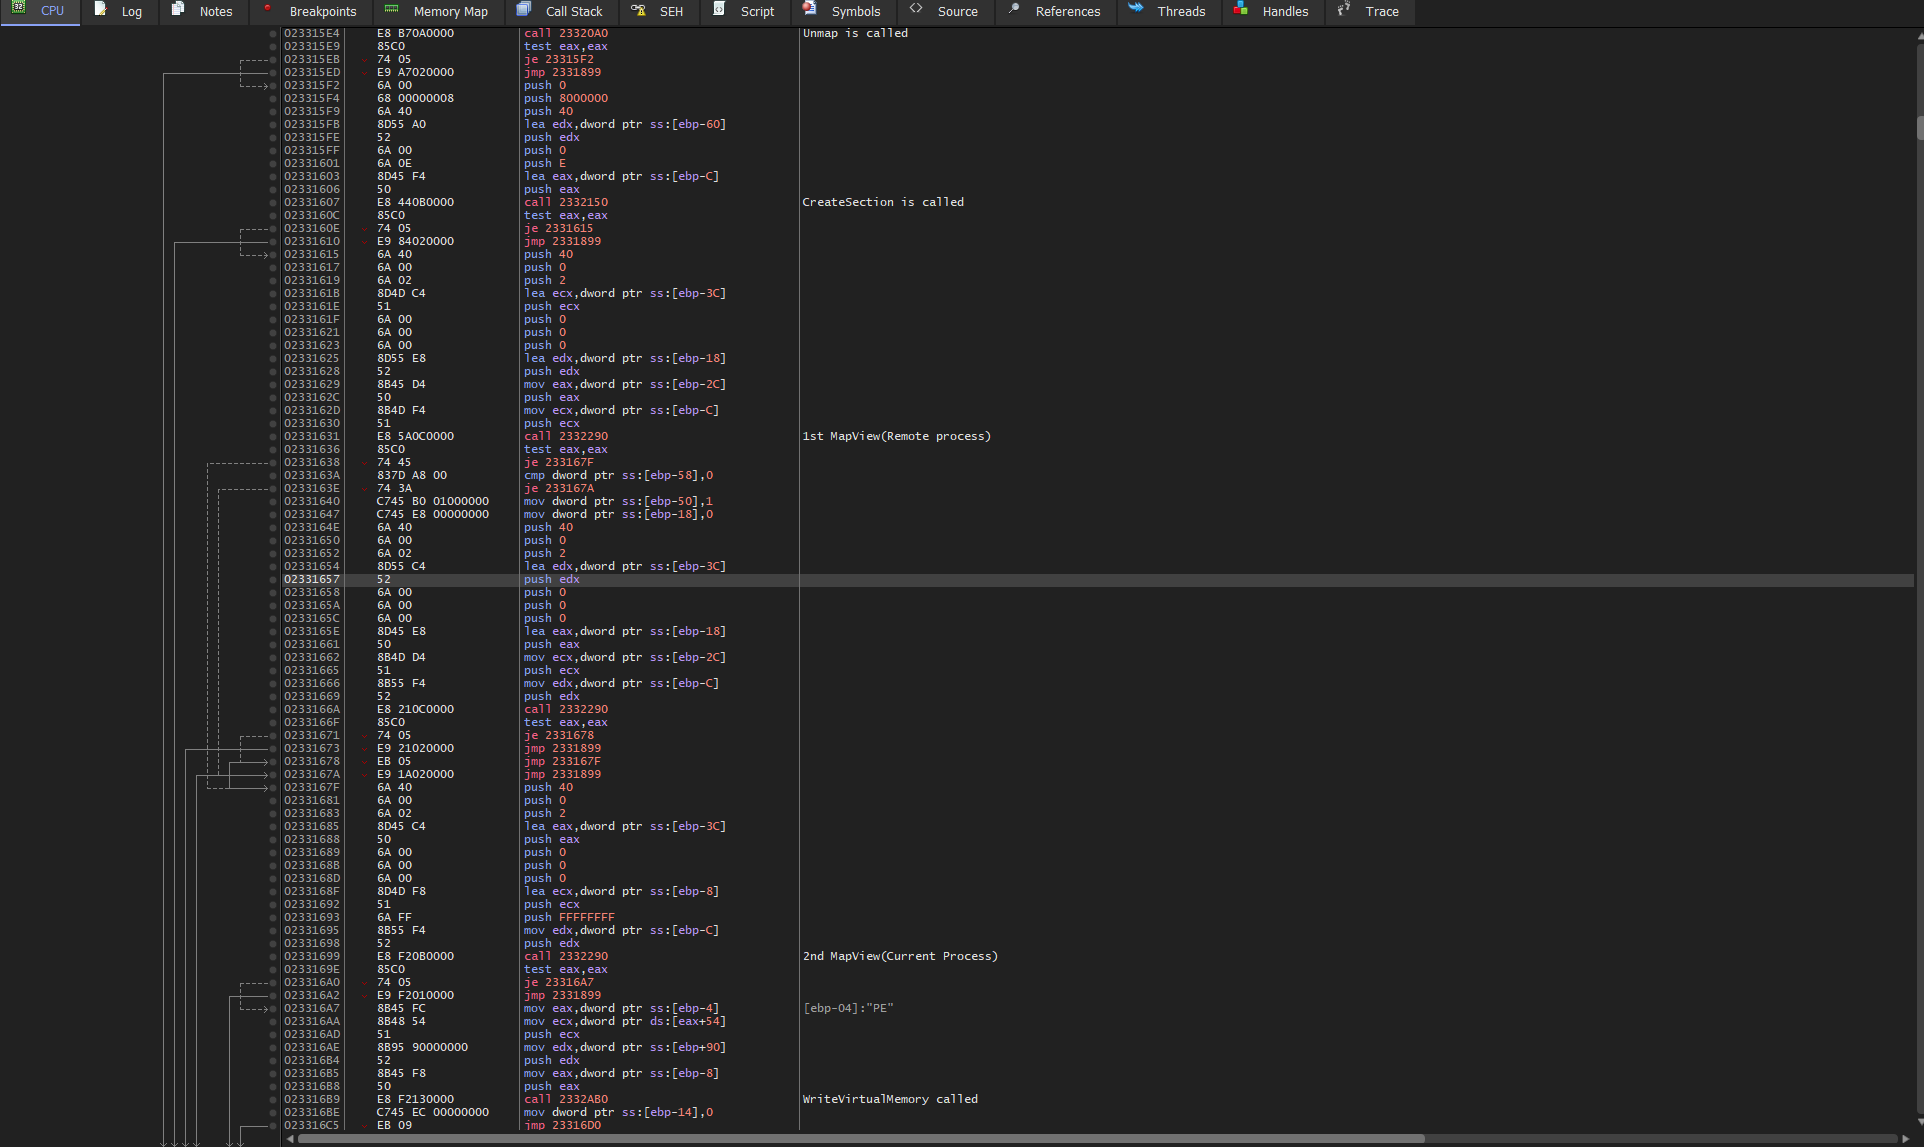
Instead of using a api to fill this section, there is a custom function which fills this space. if you can remember the esi function structure I discussed in the previous post, you can see another PE file(basically 2 PE files one with RX permission another with only RW permission) this second PE file is 2nd programs code.
Now that we know the flow of the program, we can use x32dbg to go to this function and dump the PE file after it has finished writing.
If we go into this function we can see that its copying the the executable file present in the memory(esi function section 3) into the newly created section.
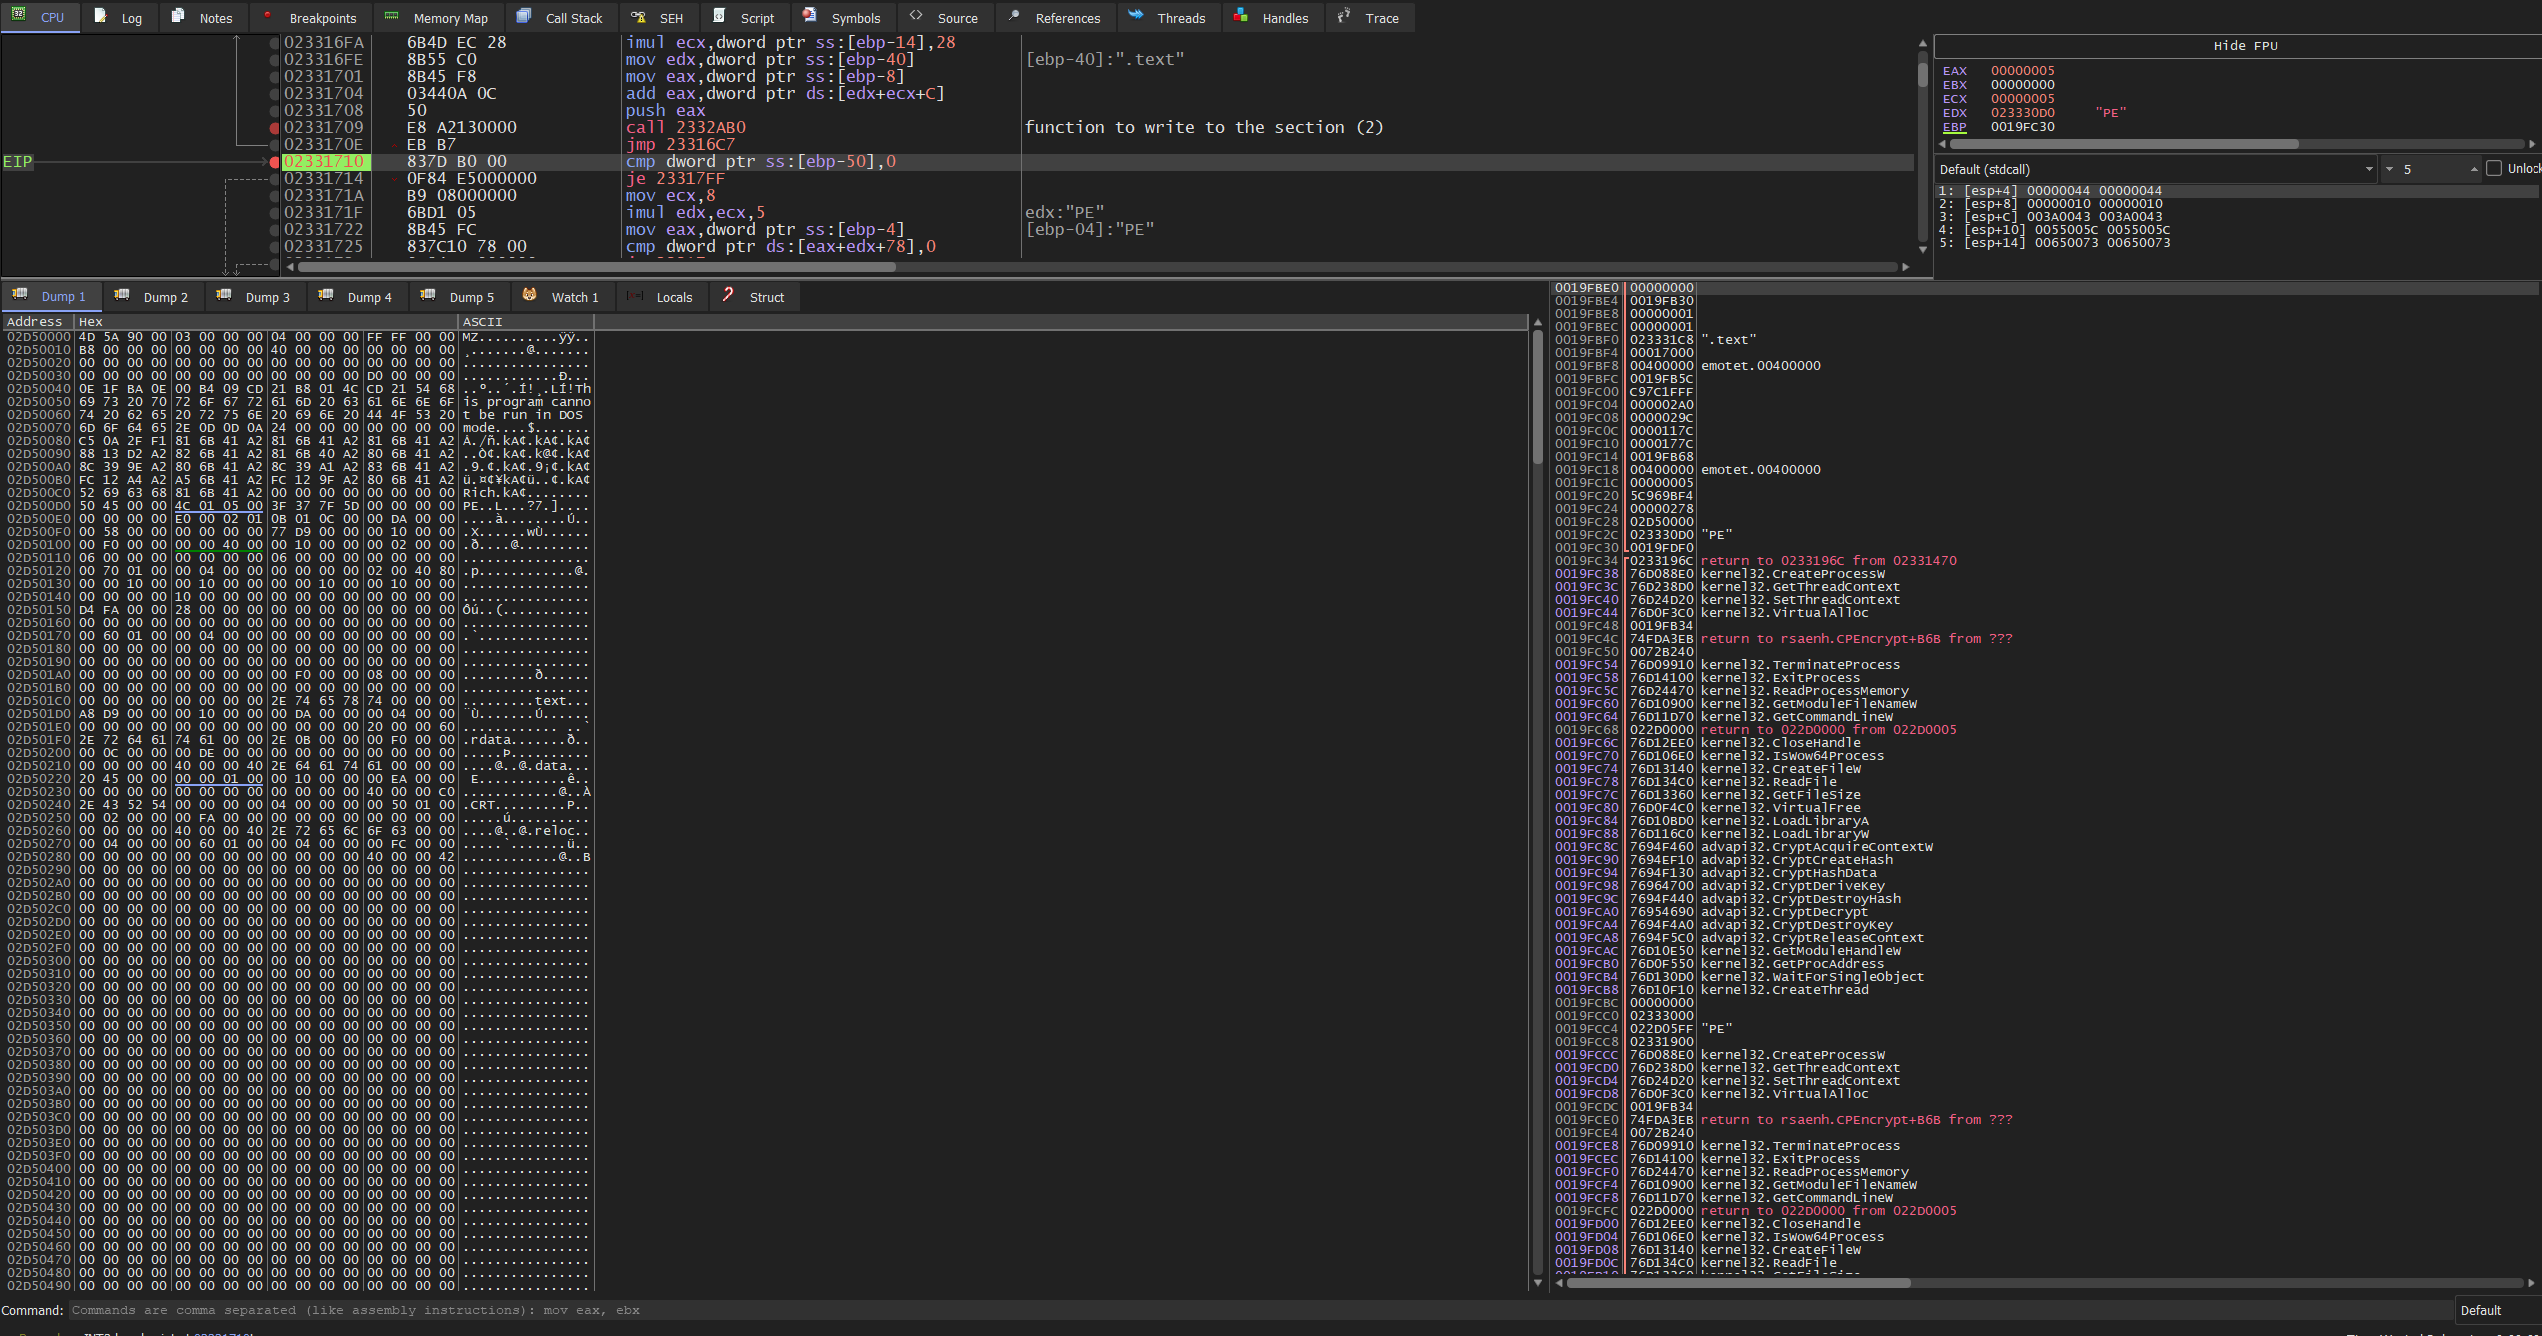
- after the execution of this function we can dump that section of memory and continue our analysis there.
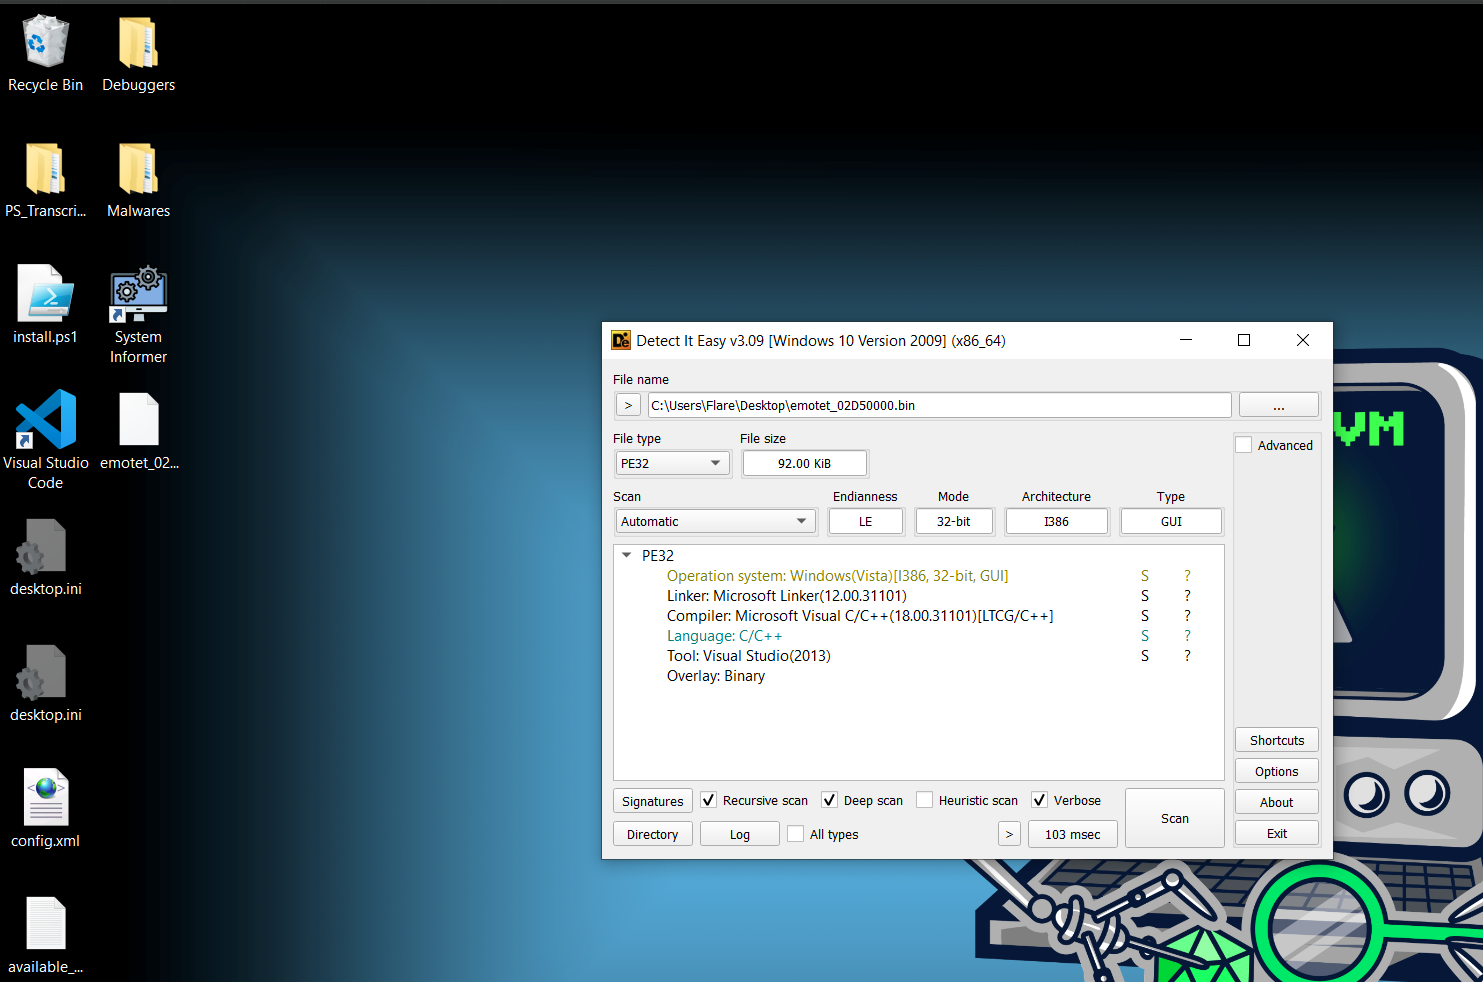
I know I could have just dumped the PE file when I found it earlier during part-1 but then I could not have learned about such interesting things like Hells gate, Reflective code loading etc.
With that being said, I did waste a lot of time thinking it was process hollowing, maybe next time I can identify this technique faster lol.
Anyways! with this I conclude part 2 of the emotet malware analysis, next I will analyze the dumped PE file! so stay tuned and Thank you for taking the time to read this! :)